. 2008 Jul;11(7):823-33.
doi: 10.1038/nn.2134. Epub 2008 May 30.

Behavior-dependent short-term assembly dynamics in the medial prefrontal cortex

Affiliations

Behavior-dependent short-term assembly dynamics in the medial prefrontal cortex

Shigeyoshi Fujisawa et al. Nat Neurosci. 2008 Jul.

Abstract

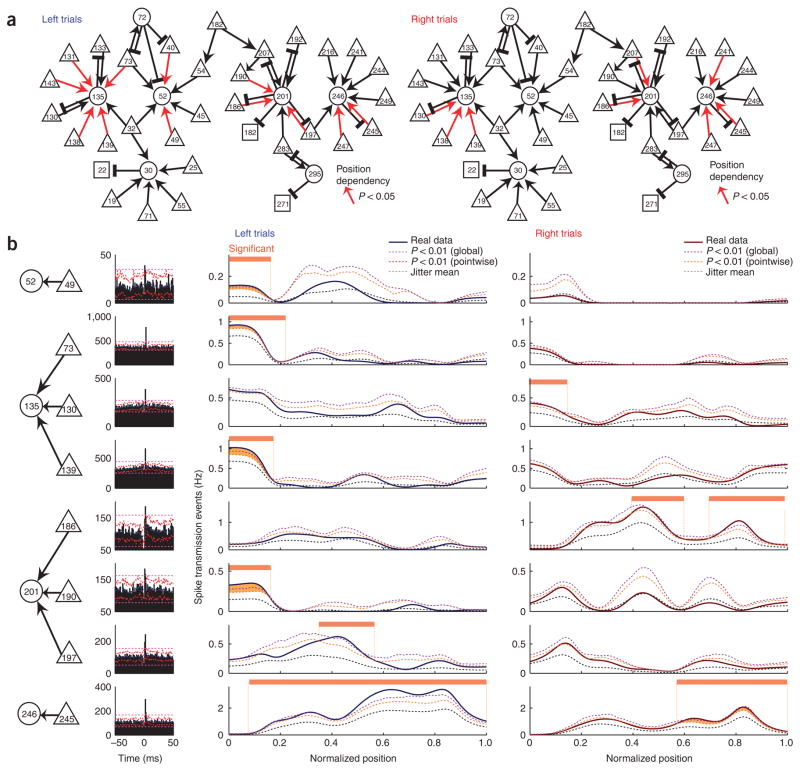
Although short-term plasticity is believed to play a fundamental role in cortical computation, empirical evidence bearing on its role during behavior is scarce. Here we looked for the signature of short-term plasticity in the fine-timescale spiking relationships of a simultaneously recorded population of physiologically identified pyramidal cells and interneurons, in the medial prefrontal cortex of the rat, in a working memory task. On broader timescales, sequentially organized and transiently active neurons reliably differentiated between different trajectories of the rat in the maze. On finer timescales, putative monosynaptic interactions reflected short-term plasticity in their dynamic and predictable modulation across various aspects of the task, beyond a statistical accounting for the effect of the neurons' co-varying firing rates. Seeking potential mechanisms for such effects, we found evidence for both firing pattern-dependent facilitation and depression, as well as for a supralinear effect of presynaptic coincidence on the firing of postsynaptic targets.


Figures

Figure 1
Figure 1
Large-scale recording of multiple single units from mPFC in a working memory task. (a) A movable, two-dimensional silicon probe (eight shanks, eight sites (yellow squares) each shank; right panels) was placed in the mPFC. Top main panel, Nissl-stained sections with electrode tracks (red arrowheads). Bottom panels, higher magnification of selected sections and corresponding fluorescence pictures of the carbocyanine dye (DiI)-labeled tracks (arrowheads). Arrows, electrolytic lesion marks of the deepest recording site of three selected shanks in layer 1 of the prelimbic (PL) cortex. IL, infralimbic cortex; ACd, anterior cingulate cortex; PrCm, precentral motor area; MOP, primary motor area. (b) Odor-based matching-to-sample task. An odor cue (chocolate or cheese) is presented following a nose-poke in a start box (position 0). Cheese or chocolate odor signals the availability of cheese or chocolate reward in the left or right goal area (position 1), respectively. Travel trajectories were linearized and represented parametrically as a continuous, one-dimensional line for each trial. (c) Firing pattern of a layer 2/3 mPFC neuron during right and left trials. Inset, superimposed traces of the mean waveform (blue) and single spikes (white) from this unit (1 Hz–8 kHz). Right panels, raster plots of the spikes as a function of location and position-dependent firing rates for this neuron. Note that we plot firing rate as a function of position but express the rate by its frequency (Hz) with respect to time. Rate is normalized by the amount of time the rat spends at each position. Red, right turns; blue, left turns, in this and subsequent figures. Two types of statistical assessment are shown: pointwise (orange) and globally (purple) significant differences (P < 0.05; we determined a segment as significant if it satisfied the global criteria of significance, but, once a segment was established as significant, we used pointwise criteria to determine the segment’s (spatial) extent; see Methods; Supplementary Fig. 4).
Figure 2
Figure 2
Behavior- and position-selective firing activity of PFC single neurons. (a) Firing patterns of neurons recorded simultaneously in either layer 2/3 (n = 117) or layer 5 (n = 142) in two rats. Each row represents the position-dependent firing rate of a single neuron (normalized relative to its peak firing rate). Neurons were ordered by the location of their peak firing rates relative to the rat’s position in the maze. Top frames, neurons with higher peak rates during left-turn trials; bottom frames, higher peak rates during right trials. Third columns, segments with significantly higher discharge rates during left (blue) or right (red) turns (see Fig. 1c and Supplementary Fig. 4). (b) Firing rates of putative pyramidal cells and putative interneurons (see Fig. 3) and fraction of neurons with significant side differences in the different maze segments pooled from all rats and sessions. (c) Percentage of neurons firing at least one spike in consecutive 100-ms windows (mean ± s.d.). (d) Mean firing rates of the neuronal populations (± s.d.). *P < 0.05, **P < 0.01, t-test. (e) Mean fraction of maze lengths discriminated by firing rates of single neurons (± s.d.).
Figure 3
Figure 3
Physiological identification of pyramidal cells and interneurons. (a) Examples of cross-correlograms (CCG) between neuron pairs. Short-latency (< 5 ms) narrow peak (top) identifies the reference cell as a putative excitatory (pyramidal) neuron. Short-latency suppression of spikes (bottom) identifies the reference cell as an inhibitory interneuron. Blue line, mean of time-jittered spikes; red line, point wise comparison (P < 0.01); magenta line, global comparison (P < 0.01; for explanation, see Methods; Supplementary Fig. 9; ref 18). The pairs shown here were recorded by the different shanks. (b) Cross-correlogram matrix based on simultaneously recorded neuron pairs (n = 1172) in a single session. Red pixel, monosynaptic connection (based on significant short-latency peaks) with reference neuron as putative pyramidal cell (n = 48); blue pixel, monosynaptic connection with reference neuron as putative interneuron (n = 30); green pixel, nonsignificant (NS) interaction. (c) Calculated two-dimensional position of pyramidal (Pyr), interneuron (Int) and unidentified (Un) neuron types, relative to the recording sites. Color coding indicates whether the neuron discriminated maze segments during right (R, red), left (L, blue) or both trajectories (R&L, magenta) in the task (Fig. 1). (d) Of the physiologically identified neurons, a sizable fraction belonged to a single ‘hub’ of network (33% of 117 cells). Arrows, putative excitatory connections; cross-bars, inhibitory connections. (e) Excitatory and inhibitory connection probabilities (based on n = 62,408 pairs from four rats). (f) Connection probability as a function of the distance between recoded neurons. (Exact) Clopper-Pearson confidence intervals (P < 0.01) are used in e,f.
Figure 4
Figure 4
Task-dependent changes in monosynaptic interactions. (a) Short-term cross-correlograms between a putative pyramidal cell (cell 1) and interneuron (cell 2) as a function of the rat’s position in 40 sliding subsegments of the maze (each cross-correlogram window overlapped by four segments) during left-turn trajectories. Top right, session mean. Inset, superimposed traces of the mean waveforms (black) and single spikes (gray) of the respective units (1 Hz–8 kHz). Cells 1 and 2 were recorded by different shanks. (b) Top two panels, position-dependent raster plots and mean firing rates of each neuron. Third panel, coincident (within 4 ms) spikes of the two neurons (crosses). Bottom panel, comparison of real and jittered surrogate (the ‘expected coincidence’) data. Maze segments where statistically significant monosynaptic (mono) interactions were detected are shown in orange. Significant segments were determined as in Figure 1 (see Methods; Supplementary Fig. 12).
Figure 5
Figure 5
Task-dependent changes of monosynaptic interactions are demonstrable beyond a statistical accounting for firing rate changes. (a) Putative monosynaptic connections that were active selectively in maze segments during left or right turn trajectories (15 of 36 excitatory connections; same set of neurons, and session, as in Fig. 3d). (b) Cross-correlograms (left) and maze position dependence (right two columns) of the significant interactions in a subset of cell pairs from a. Real and jittered surrogates as in Figure 4. (See Methods; Supplementary Fig. 12.) Note that monosynaptic efficacy can vary despite little or no variation in the co-firing rates, assayed by the expected coincidence count (see also Supplementary Fig. 13). The neurons in pair 73-135 were recorded from different shanks.
Figure 6
Figure 6
Spike transmission efficacy depends on the firing pattern of the presynaptic neuron. (a) Illustration of depressing and facilitating pyramidal-interneuron connections. (b) Convergence of excitation from two putative pyramidal cells on an interneuron. Cross-correlograms between neuron pairs conditioning separately on the first and subsequent (second~) spikes of trains. ‘First spikes’, spikes with long interspike intervals (ISIs) (>200 ms); ‘second~ spikes’ spikes with short interspike intervals (< 40 ms). The rate-normalized height of the monosynaptic peak transmission was used to quantify synaptic ‘strength’ (see Supplementary Fig. 9). (c) Distribution of peak height differences between first and subsequent spikes in all neuron pairs. Significantly depressing (12.7%) and facilitating (10.7%) synapses are shown in blue and orange, respectively. Among the significant pairs, 32.2% were recorded by different shanks. Significant differences of peak heights were computed by a permutation test (shuffling the first spike, second~ spike labels, P < 0.10, two-sided test; one side corresponds ‘facilitation’, the other to ‘depression’). See also Supplementary Figures 14–16 online.
Figure 7
Figure 7
Coincident firing of more than one neuron facilitates spike transmission. (a) Left, representative ‘satellite’ network with eight putative pyramidal cells converging on an interneuron. Center, spike transmission probability as a function of the number of coincident spikes among two or more neurons within increasing time windows. Right, frequency of coincident events. Note supralinear facilitation at < 5-ms intervals. Cells 32 and 72 were recorded from different shanks than the interneuron (135). (b) Group data for all satellites using 5-ms time windows (mean ± s.d., n = 14; inset, individual satellites).

References

    1. Hebb DO. The Organization of Behavior. Wiley; New York: 1949. - PubMed
    1. Gupta A, Wang Y, Markram H. Organizing principles for a diversity of GABAergic interneurons and synapses in the neocortex. Science. 2000;287:273–278. - PubMed
    1. Hempel CM, Hartman KH, Wang XJ, Turrigiano GG, Nelson SB. Multiple forms of short-term plasticity at excitatory synapses in rat medial prefrontal cortex. J Neurophysiol. 2000;83:3031–3041. - PubMed
    1. Wang Y, et al. Heterogeneity in the pyramidal network of the medial prefrontal cortex. Nat Neurosci. 2006;9:534–542. - PubMed
    1. Markram H, et al. Interneurons of the neocortical inhibitory system. Nat Rev Neurosci. 2004;5:793–807. - PubMed

Publication types