. 2008 Jul;10(7):825-36.
doi: 10.1038/ncb1744. Epub 2008 May 30.

Opposing roles for p16Ink4a and p19Arf in senescence and ageing caused by BubR1 insufficiency

Affiliations

Opposing roles for p16Ink4a and p19Arf in senescence and ageing caused by BubR1 insufficiency

Darren J Baker et al. Nat Cell Biol. 2008 Jul.

Erratum in

  • Nat Cell Biol. 2012 Jun;14(6):649. Pitel, Kevin [corrected to Pitel, Kevin S]

Abstract

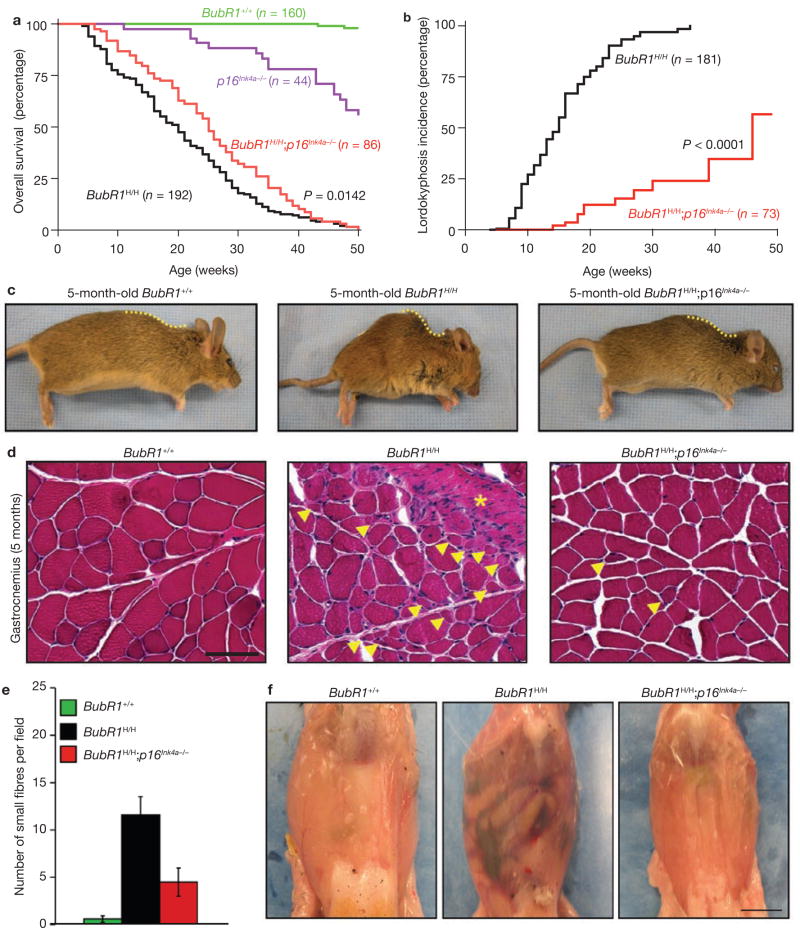
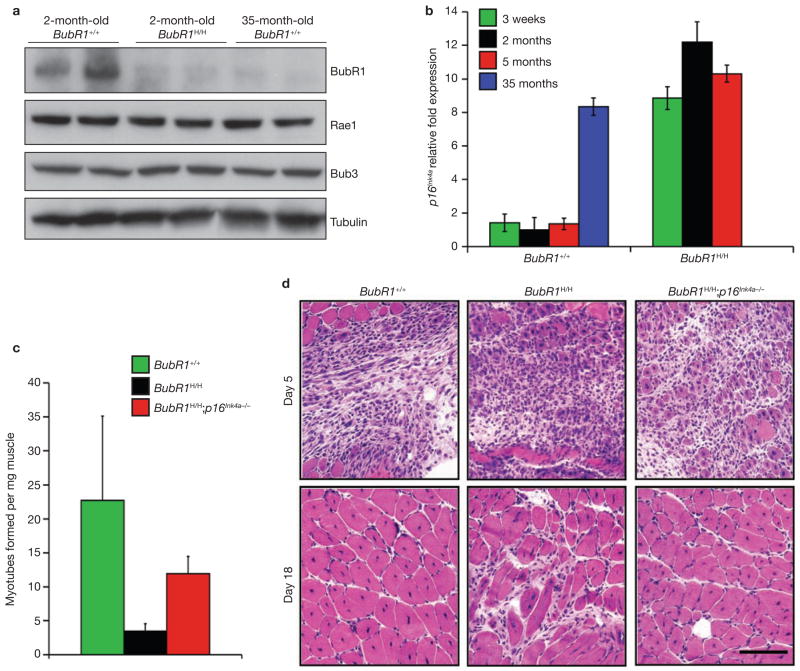
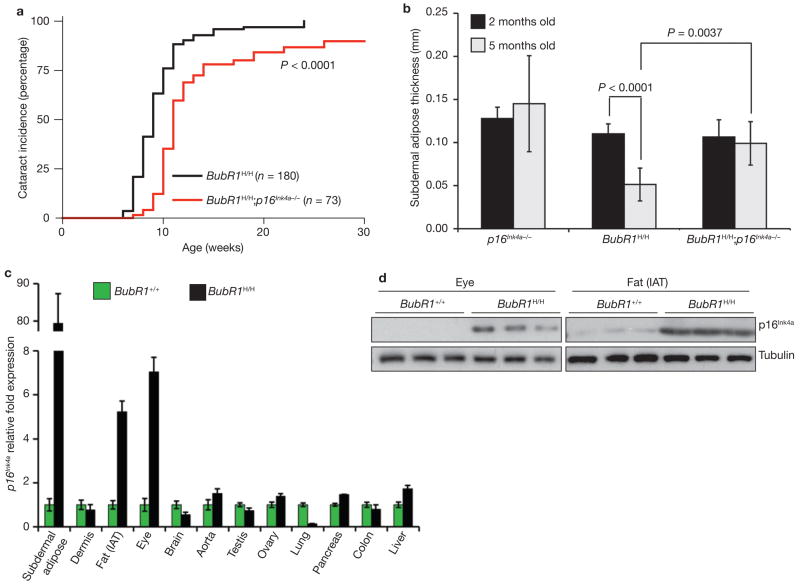
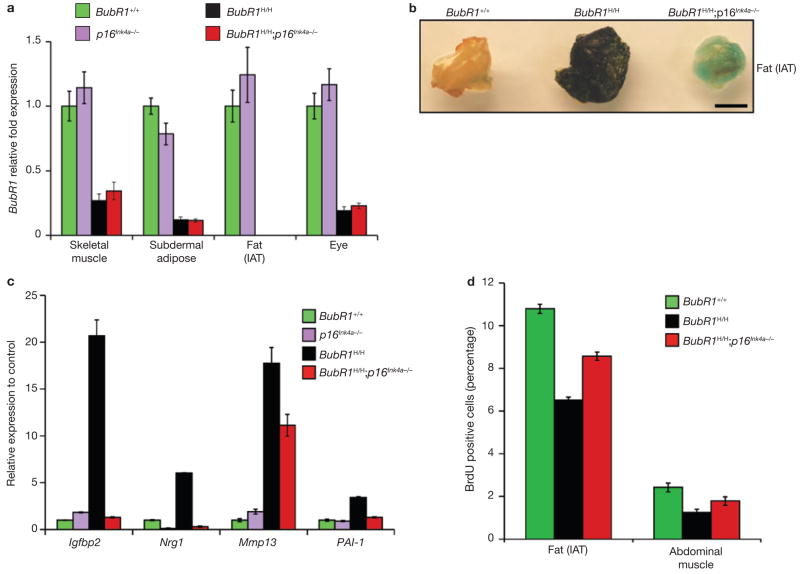
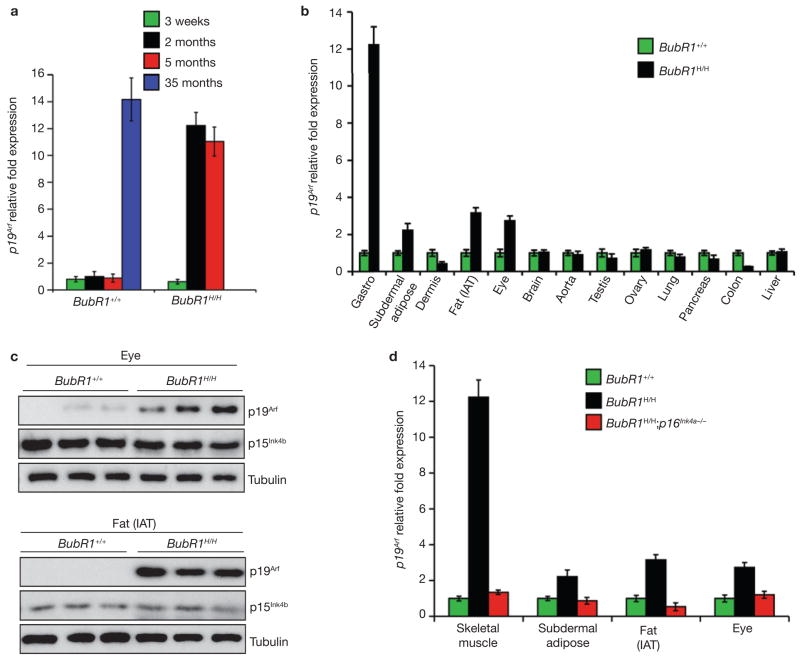
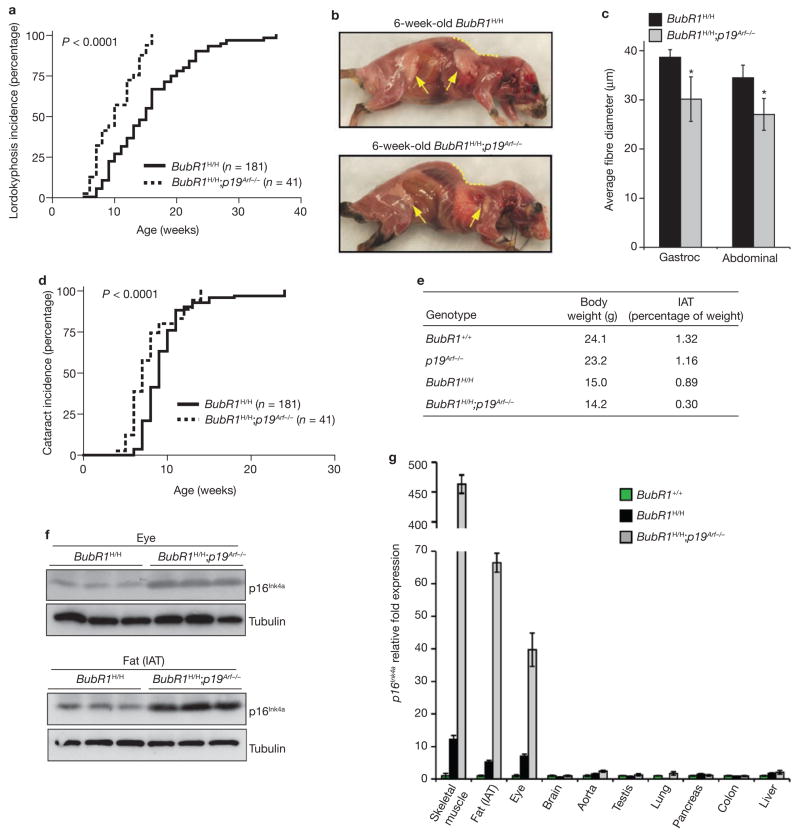
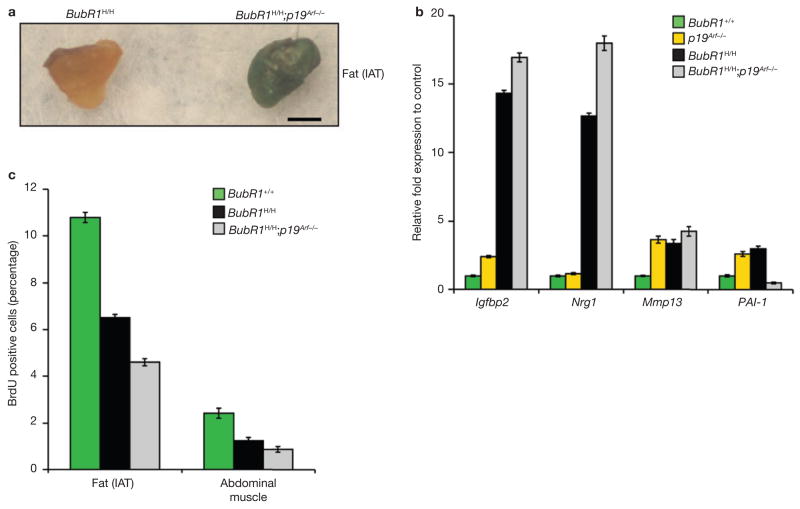
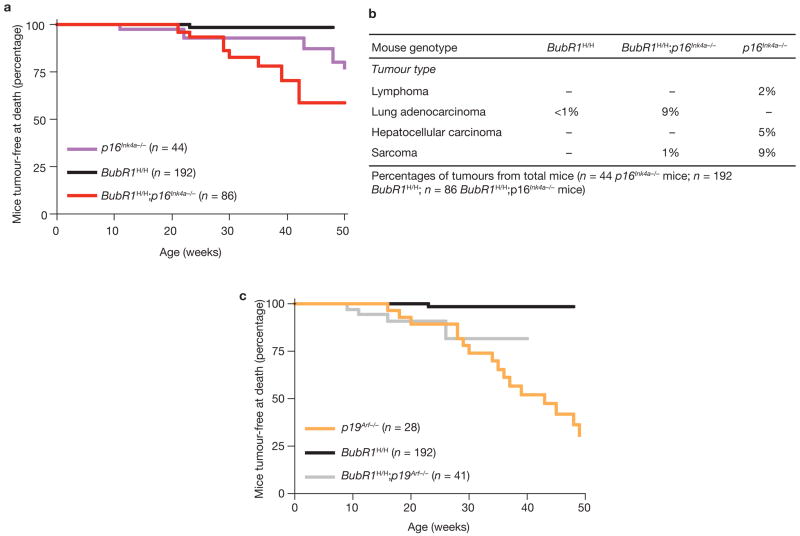
Expression of p16(Ink4a) and p19(Arf) increases with age in both rodent and human tissues. However, whether these tumour suppressors are effectors of ageing remains unclear, mainly because knockout mice lacking p16(Ink4a) or p19(Arf) die early of tumours. Here, we show that skeletal muscle and fat, two tissues that develop early ageing-associated phenotypes in response to BubR1 insufficiency, have high levels of p16(Ink4a) and p19(Arf). Inactivation of p16(Ink4a) in BubR1-insufficient mice attenuates both cellular senescence and premature ageing in these tissues. Conversely, p19(Arf) inactivation exacerbates senescence and ageing in BubR1 mutant mice. Thus, we identify BubR1 insufficiency as a trigger for activation of the Cdkn2a locus in certain mouse tissues, and demonstrate that p16(Ink4a) is an effector and p19(Arf) an attenuator of senescence and ageing in these tissues.


Figures

Figure 1
Figure 1
Ablation of p16Ink4a in BubR1H/H mice extends lifespan and attenuates sarcopaenia. (a) Overall survival curves for wild-type, p16Ink4a−/−, BubR1H/H and BubR1H/H;p16Ink4a−/− mice. The median overall survival of combined BubR1H/H;p16Ink4a−/− mice is 25 weeks, a 25% extension in lifespan compared with BubR1H/H animals. We note that the p16Ink4a−/−, BubR1H/H and BubR1H/H;p16Ink4a−/− curves are all significantly different from the wild-type (BubR1+/+) curve (P < 0.0001, log-rank tests). Moreover, the BubR1H/H;p16Ink4a−/− curve is significantly different from the BubR1H/H curve (P = 0.0142). (b) Incidence and latency of lordokyphosis in BubR1H/H and BubR1H/H;p16Ink4a−/− mice. The curves are significantly different (P < 0.0001, log-rank test). We note that no wild-type or p16Ink4a−/− mice developed lordokyphosis during our one-year observation period (data not shown). (c) Images of 5-month-old wild-type, BubR1H/H and BubR1H/H;p16Ink4a−/− mice. Note the profound difference in the curvature of the spine in the BubR1H/H;p16Ink4a−/− mouse. (d) Cross-sections of gastrocnemius muscles from 5-month-old wild-type, BubR1H/H and BubR1H/H;p16Ink4a−/− mice. Arrowheads mark degenerated fibres and asterisks mark areas of connective tissue infiltration. Scale bar is 100 μm. (e) Quantification of the number of deteriorating (atrophic) muscle fibres in gastrocnemius muscles shown in d. Note that BubR1H/H;p16Ink4a−/− muscles have 3-fold less atrophic fibres than BubR1H/H muscles. Data are mean ± s.d. (n = 4). (f) Skinned 5-month-old wild-type, BubR1H/H and BubR1H/H;p16Ink4a−/− mice demonstrating that abdominal wall thickness is visually increased in BubR1H/H;p16Ink4a−/− mice when compared with BubR1H/H animals. Scale bar is 1 cm.
Figure 2
Figure 2
Inverse correlation between BubR1 and p16Ink4a expression levels with ageing. (a) Western blot analysis of gastrocnemius muscle in young wild-type and BubR1H/H mice and old wild-type mice. Blots were probed with antibodies against BubR1, Bub3 and Rae1. Anti-tubulin was used as a loading control. Note that the mitotic checkpoint proteins Bub3 and Rae1 remain highly expressed as wild-type mice age. Uncropped images of the scans are shown in Supplementary Information, Fig. S6a. (b) p16Ink4a expression in wild-type and BubR1H/H gastrocnemius muscles at various ages analysed by qRT–PCR. Data are mean ± s.d. (n = 3 males per genotype and age group, with triplicate measurements taken). Values were normalized to GAPDH. Relative fold expression is to 2-month-old wild-type values. (c) Myotube formation potential of gastrocnemius muscles from 5-month-old mice of the indicated genotypes analysed by a well-standardized in vitro assay. Data are mean ± s.d. (n = 4). (d) Cardiotoxin-treated gastrocnemius muscle of 5-month-old wild-type, BubR1H/H and BubR1H/H;p16Ink4a−/− mice at 5 or 18 days after injection. Note that all gastrocnemius muscles show an extensive hypercellular response to cardiotoxin injection by day 5 regardless of genotype. Wild-type and BubR1H/H;p16Ink4a−/− mice have complete restoration of muscle architecture by myofibres with central nuclei by day 18, whereas BubR1H/H mice have been unable to restore normal tissue structure. Scale bar is 100 μm.
Figure 3
Figure 3. p16Ink4a disruption attenuates selective progeroid features of BubR1 hypomorphic mice
(a) Incidence and latency of cataract formation in BubR1H/H and BubR1H/H;p16Ink4a−/− mice as detected by the use of slit light after dilation of eyes. The curves are significantly different (P < 0.0001, log-rank test). We note that no wild-type or p16Ink4a−/− mice developed cataracts during this observation period. (b) Subcutaneous adipose layer thickness of p16Ink4a−/−, BubR1H/H and BubR1H/H;p16Ink4a−/− mice at 2 and 5 months of age. Data are mean ± s.d. (n = 4 male mice for each age per genotype). A two-tailed Mann-Whitney test was used for statistical analysis. (c) qRT–PCR analysis for relative expression of p16Ink4a in a variety of 2-month-old tissues from BubR1H/H and wild-type mice. Values were normalized to GAPDH, and relative fold is to 2-month-old wild-type samples. Data are mean ± s.d. (n = 3 male mice for each tissue, with triplicate measurements taken). (d) Western blots of eye and fat extracts from 2-month-old BubR1+/+ and BubR1H/H mice probed with anti-p16Ink4a antibody. Anti-tubulin antibody served as loading control. Uncropped images of the scans are shown in Supplementary Information, Fig. S6b, c.
Figure 4
Figure 4. p16Ink4a induction in BubR1H/H mice promotes cellular senescence
(a) Relative expression of BubR1 in gastrocnemius, subdermal adipose, fat deposits and eyes from 2-month-old wild-type, p16Ink4a−/−, BubR1H/H and BubR1H/H;p16Ink4a−/− mice as determined by qRT–PCR. Values were normalized to GAPDH. Relative fold is to 2-month-old wild-type samples. Data are mean ± s.d. (n = 3 male mice per genotype, with triplicate measurements taken per sample). We note that ablation of p16Ink4a was unable to increase the amount of BubR1 present in either wild-type or BubR1 hypomorphic mice. (b) IAT of 5-month-old wild-type, BubR1H/H and BubR1H/H;p16Ink4a−/− mice stained for SA-β-galactosidase activity. Scale bar is 2 mm. (c) Relative expression of senescence markers in gastrocnemius muscles of 2-month-old wild-type, p16Ink4a−/−, BubR1H/H and BubR1H/H;p16Ink4a−/− mice analysed by qRT–PCR. Data are mean ± s.d. (n = 3 male mice per genotype). Values were normalized to GAPDH. Relative fold expression is to 2-month-old wild-type muscle. (d) Analysis of replicative senescence in skeletal muscle and fat of 2-month-old wild-type, BubR1H/H and BubR1H/H;p16Ink4a−/− mice by analysing in vivo BrdU incorporation. Data are mean ± s.d. (n = 3 males per genotype).
Figure 5
Figure 5
p19Arf is elevated in BubR1 hypomorphic tissues with high p16Ink4a. (a) Skeletal muscles of wild-type and BubR1H/H mice of various ages were analysed for p19Arf expression by qRT–PCR. All values were normalized to GAPDH. Data are mean ± s.d. (n = 3 mice were used per genotype and age group). (b) Relative expression of p19Arf in various tissues of 2-month-old BubR1H/H and BubR1+/+ mice as measured by qRT–PCR. Data are mean ± s.d. (n = 3 males per genotype). All values were normalized to GAPDH. Relative expression is to wild-type samples. (c) Western blots of eye and fat extracts from 2-month-old BubR1+/+ and BubR1H/H mice probed with anti-p19Arf and p15Ink4b antibodies. Anti-tubulin antibody was used as a loading control. Uncropped images of the scans are shown in Supplementary Information, Fig. S6b, c. (d) Relative expression of p19Arf in skeletal muscle (gastrocnemius), subdermal adipose, fat deposits and eyes of 2-month-old wild-type, BubR1H/H and BubR1H/H;p16Ink4a−/− mice as determined by qRT–PCR. Data are mean ± s.d. (n = 3 males per genotype). All values were normalized to GAPDH. Relative expression is to wild-type samples.
Figure 6
Figure 6
Accelerated ageing in BubR1H/H mouse tissues with increased p16Ink4a expression when p19Arf is lacking. (a) Incidence and latency of lordokyphosis in BubR1H/H and BubR1H/H;p19Arf−/− mice. The curves are significantly different (P < 0.0001, log-rank test). (b) Skinned 6-week-old BubR1H/H and BubR1H/H;p19Arf−/− males. Note that the BubR1H/H;p19Arf−/− mouse has more profound lordokyphosis (dotted line) and reduced subcutaneous fat deposits (arrows). (c) Average muscle fibre size of gastrocnemius (Gastroc) and abdominal muscles of BubR1H/H and BubR1H/H;p19Arf−/− males. Data are mean ± s.d. (n = 3 mice per genotype). A two-tailed Mann-Whitney test was used for statistics. For both comparisons, P < 0.0001. (d) Incidence and latency of cataract formation in BubR1H/H and BubR1H/H;p19Arf−/− mice. The curves are significantly different (P < 0.0001, log-rank test). (e) Amount of inguinal adipose tissue in 6-week-old mice of the indicated genotypes. IAT is expressed as percentage of total body weight. Three male mice of each genotype were used. (f) Western blots of eye and fat extracts from 2-month-old BubR1H/H and BubR1H/H;p19Arf−/− mice probed with anti-p16Ink4a and anti-tubulin antibody. Uncropped images of the scans are shown in Supplementary Information, Fig. S6d. (g) Relative expression of p16Ink4a in various tissues of 2-month-old BubR1+/+, BubR1H/H and BubR1H/H;p19Arf−/− mice as measured by qRT–PCR. Data are mean ± s.d. (n = 3 males per genotype). All values were normalized to GAPDH. Relative expression is to wild-type samples.
Figure 7
Figure 7
Senescence increases in BubR1H/H tissues with high p16Ink4a when p19Arf is lacking. (a) IAT of 2-month-old BubR1H/H and BubR1H/H;p19Arf−/− mice stained for SA-β-galactosidase activity. Scale bar is 2 mm. (b) Relative expression of senescence markers in gastrocnemius muscles of 6-week-old wild-type, p19Arf−/−, BubR1H/H and BubR1H/H;p19Arf−/− mice. All values were normalized to GAPDH. Relative fold expression is to wild-type gastrocnemius. Data are mean ± s.d. (n = 3 male mice were evaluated per genotype). (c) Replicative senescence in skeletal muscle and fat of 2-month-old wild-type, BubR1H/H and BubR1H/H;p19Arf−/− mice as analysed by in vivo BrdU incorporation. Data are mean ± s.d. (n = 3 male mice per genotype were used for this experiment).
Figure 8
Figure 8
Ablation of p16Ink4a accelerates lung tumorigenesis in BubR1 insufficient mice. (a) Percentage of mice with tumours at time of death as a function of time for p16Ink4a−/−, BubR1H/H and BubR1H/H;p16Ink4a−/− mice. Biopsies were performed on moribund animals and all tissues were screened for tumours. Tumour tissues were collected and processed for histological confirmation. The BubR1H/H;p16Ink4a−/− curve is significantly different from the BubR1H/H curve with P = 0.0027 (calculated using a log-rank test). (b) Tumour spectra of p16Ink4a−/−, BubR1H/H and BubR1H/H;p16Ink4a−/− mice. (c) As in a but for p19Arf−/−, BubR1H/H and BubR1H/H;p19Arf−/− mice. There is no significant difference between the curves of BubR1H/H;p19Arf−/− and p19Arf−/− mice using a log-rank test.

References

    1. Collado M, Blasco MA, Serrano M. Cellular senescence in cancer and aging. Cell. 2007;130:223–233. - PubMed
    1. Campisi J, d’Adda di Fagagna F. Cellular senescence: when bad things happen to good cells. Nature Rev Mol Cell Biol. 2007;8:729–740. - PubMed
    1. Sharpless NE, DePinho RA. The INK4A/ARF locus and its two gene products. Curr Opin Genet Dev. 1999;9:22–30. - PubMed
    1. Sherr CJ, Weber JD. The ARF/p53 pathway. Curr Opin Genet Dev. 2000;10:94–99. - PubMed
    1. Vousden KH, Lane D. P p53 in health and disease. Nature Rev Mol Cell Biol. 2007;8:275–283. - PubMed

Publication types

MeSH terms