Comparative Study
. 2007 Jun;1(1):84-96.
doi: 10.1016/j.molonc.2007.02.004.

The morphologies of breast cancer cell lines in three-dimensional assays correlate with their profiles of gene expression

Affiliations
Comparative Study

The morphologies of breast cancer cell lines in three-dimensional assays correlate with their profiles of gene expression

Paraic A Kenny et al. Mol Oncol. 2007 Jun.

Abstract

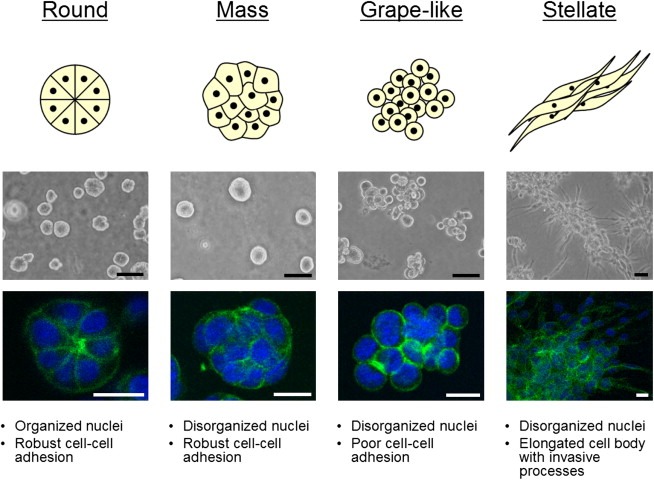
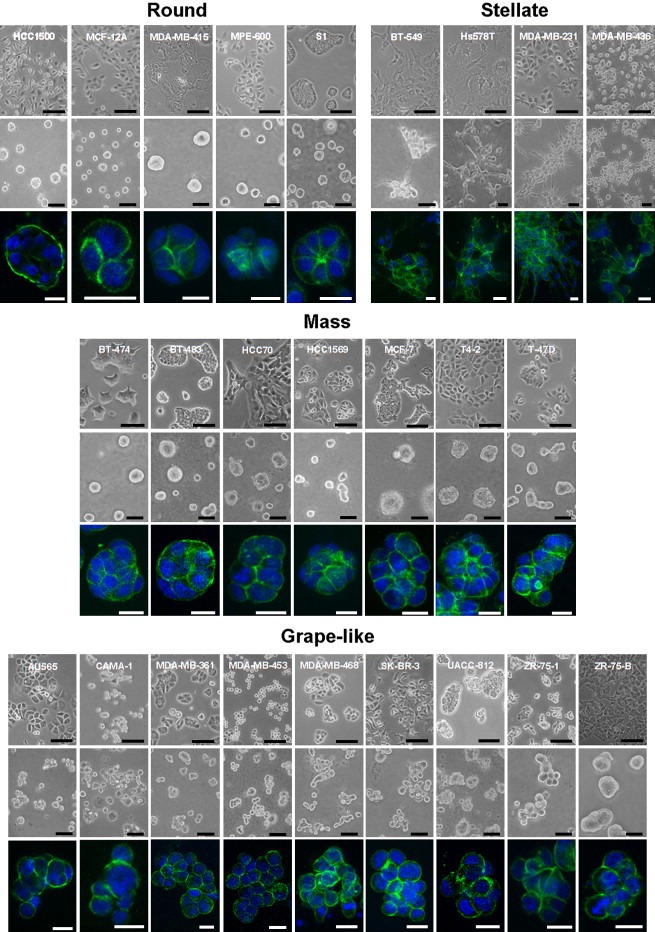
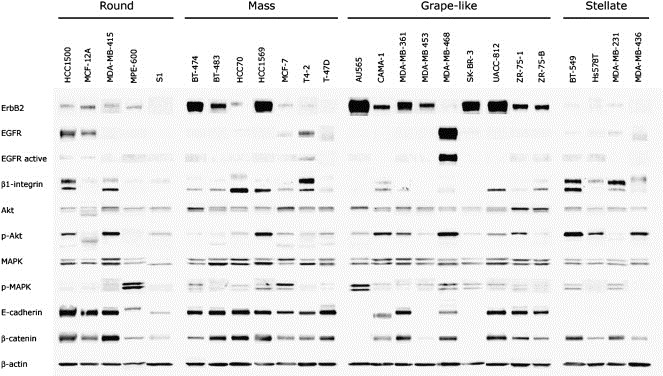
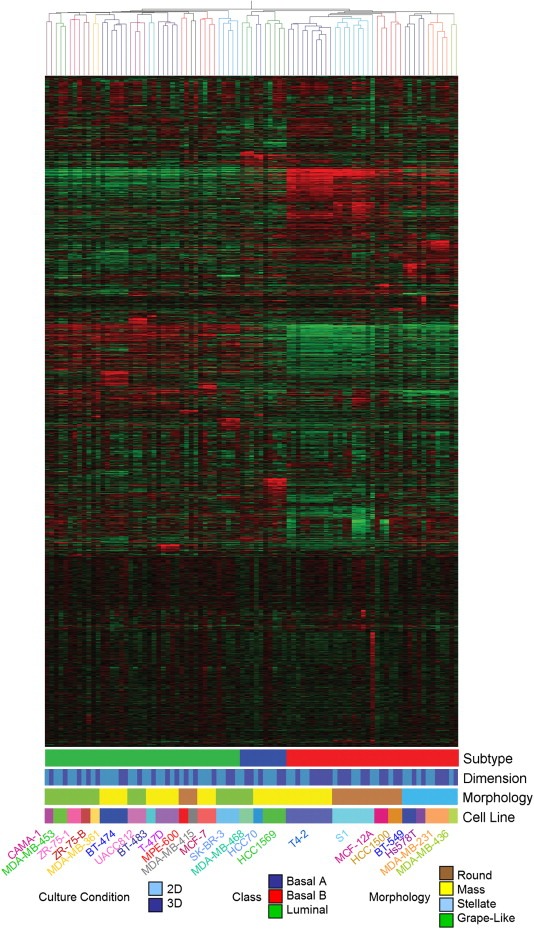
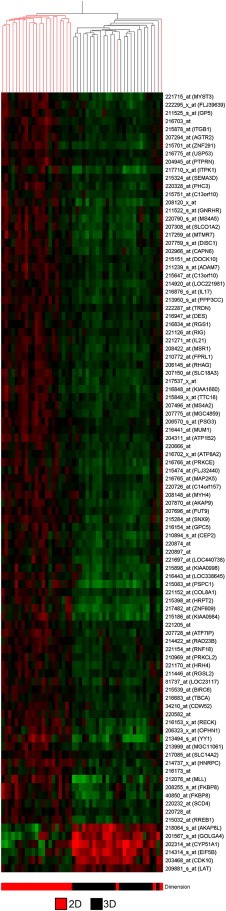
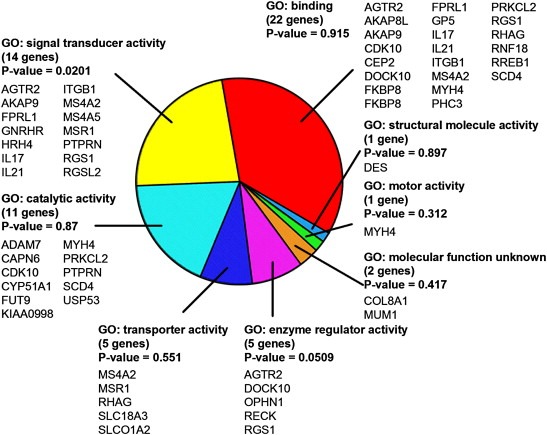
3D cell cultures are rapidly becoming the method of choice for the physiologically relevant modeling of many aspects of non-malignant and malignant cell behavior ex vivo. Nevertheless, only a limited number of distinct cell types have been evaluated in this assay to date. Here we report the first large scale comparison of the transcriptional profiles and 3D cell culture phenotypes of a substantial panel of human breast cancer cell lines. Each cell line adopts a colony morphology of one of four main classes in 3D culture. These morphologies reflect, at least in part, the underlying gene expression profile and protein expression patterns of the cell lines, and distinct morphologies were also associated with tumor cell invasiveness and with cell lines originating from metastases. We further demonstrate that consistent differences in genes encoding signal transduction proteins emerge when even tumor cells are cultured in 3D microenvironments.

Keywords: 3D culture; Breast cancer; extracellular matrix; gene expression profiling; signal transduction.


Figures

Figure 1
Figure 1
Breast cell line colony morphologies in 3D culture fall into four distinct groups. A panel of 25 breast cell lines were cultured in three‐dimensions and grouped into four distinct morphologies. A schematic and key descriptors of each morphology is shown in addition to phase contrast and F‐actin and nuclear fluorescence images of representative cell lines of each morphology: for Round, S1 is shown; Mass, BT‐474; Grape‐like, SK‐BR‐3; and Stellate, MDA‐MB‐231. Scale bars: phase contrast, 50μm; fluorescence, 20μm.
Figure 2
Figure 2
Morphologies of breast cell lines cultured in two‐ and three‐dimensions. Phase contrast images of the complete panel of 25 breast cell lines cultured on tissue culture plastic (top panel) and in the 3D lrECM assay (middle panel) are shown grouped by 3D morphological classification: Round, Mass, Grape‐like and Stellate. 3D cultures were stained for F‐actin and nuclei were counterstained with DAPI. Optical sections of representative colonies are shown for all cell lines (bottom panel) with the exception of MDA‐MB‐468 for which a Z projection with maximum intensity projection (Image J) is shown (because of the high degree of dimensionality of the colonies generated by this cell line, optical sections appear to show single cells not evidently part of the same colony). Scale bars: top panel, 100μm; middle panel, 50μm; bottom panel, 20μm.
Figure 3
Figure 3
Western blot analysis of breast cell lines cultured in 3D. Western blot analysis of the indicated proteins is shown. Equal amounts of protein were loaded per lane, and lysates of S1 and T4‐2 were run on all separate blots as to control for equal loading and exposure time. Signal from control cell lines were semi‐quantitatively normalized across blots using S1 or T4‐2 signal for each protein in Adobe Photoshop. Normalized protein profiles for each cell line were then aligned and grouped by morphology in this composite figure (see Section 4 for additional detail).
Figure 4
Figure 4
Gene expression profiling of breast cell lines grown in two‐ and three‐dimensions. Unsupervised hierarchical clustering of 89 samples representing 24 non‐malignant and malignant breast cell lines cultured on either tissue culture plastic (2D) or lrECM (3D). Tree branches are colored to indicate cell line identity (see key on bottom of figure). Also colored in the key are the morphological group and the tumor classification to which each cell line belongs.
Figure 5
Figure 5
Genes which distinguish 2D and 3D culture conditions. All replicates were averaged so that each condition represents one cell line in either 2D or 3D culture. The 22215 Affymetrix probes were tested for association with the parameter, Dimension, using a cutoff of P < 0.00025, corrected for multiple comparisons using the Benjamini and Hochberg test. Ninety‐six probes significantly distinguished the expression profiles of cells grown on plastic from those grown on lrECM at this level of significance.
Figure 6
Figure 6
Gene Ontology analysis of genes distinguishing cells grown in 2D and 3D culture conditions. Gene Ontology analysis of the 41 of the 96 genes shown in Figure 5 for which Gene Ontology annotations were available. Genes encoding proteins involved in signal transduction are significantly overrepresented in this set (P=0.0201), while genes encoding proteins involved in the regulation of enzyme activity almost achieved statistical significance (P=0.0509).

References

    1. Albini, A. , Iwamoto, Y. , Kleinman, H.K. , Martin, G.R. , Aaronson, S.A. , Kozlowski, J.M. , McEwan, R.N. , 1987. A rapid in vitro assay for quantitating the invasive potential of tumor cells. Cancer Research. 47, 3239–3245. - PubMed
    1. Ashburner, M. , Ball, C.A. , Blake, J.A. , Botstein, D. , Butler, H. , Cherry, J.M. , Davis, A.P. , Dolinski, K. , Dwight, S.S. , Eppig, J.T. , 2000. Gene ontology: tool for the unification of biology. The Gene Ontology Consortium. Nature Genetics. 25, 25–29. - PMC - PubMed
    1. Barcellos-Hoff, M.H. , Aggeler, J. , Ram, T.G. , Bissell, M.J. , 1989. Functional differentiation and alveolar morphogenesis of primary mammary cultures on reconstituted basement membrane. Development. 105, 223–235. - PMC - PubMed
    1. Bellis, S.L. , 2004. Variant glycosylation: an underappreciated regulatory mechanism for beta1 integrins. Biochimica et Biophysica Acta. 1663, 52–60. - PubMed
    1. Bild, A.H. , Yao, G. , Chang, J.T. , Wang, Q. , Potti, A. , Chasse, D. , Joshi, M.B. , Harpole, D. , Lancaster, J.M. , Berchuck, A. , 2006. Oncogenic pathway signatures in human cancers as a guide to targeted therapies. Nature. 439, 353–357. - PubMed

Publication types

Substances