. 2008 May 30;4(5):e1000076.
doi: 10.1371/journal.ppat.1000076.

The evolutionary genetics and emergence of avian influenza viruses in wild birds

Affiliations

The evolutionary genetics and emergence of avian influenza viruses in wild birds

Vivien G Dugan et al. PLoS Pathog. .

Abstract

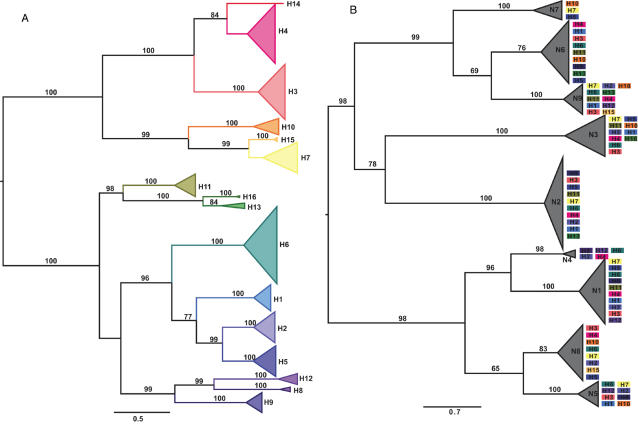
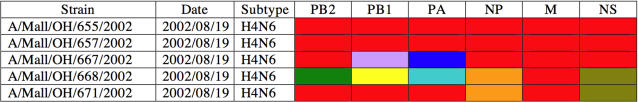
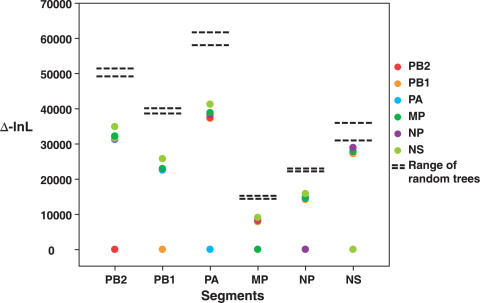
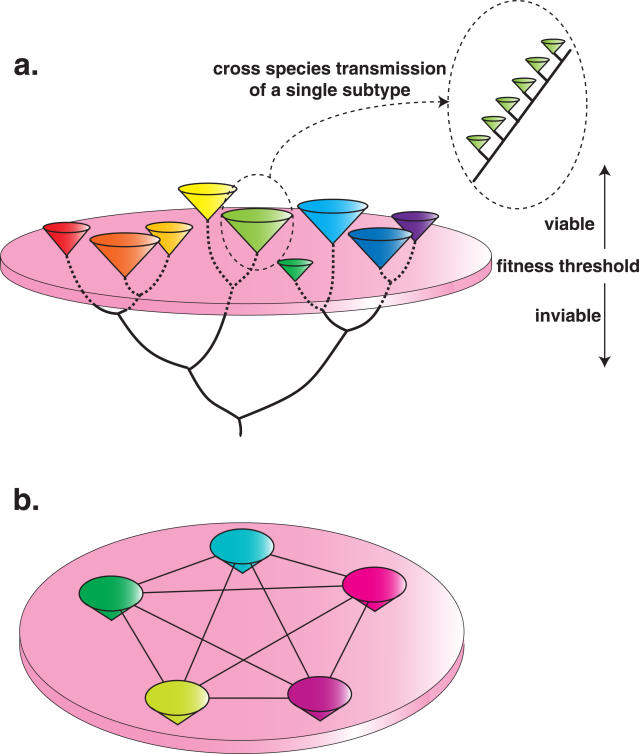
We surveyed the genetic diversity among avian influenza virus (AIV) in wild birds, comprising 167 complete viral genomes from 14 bird species sampled in four locations across the United States. These isolates represented 29 type A influenza virus hemagglutinin (HA) and neuraminidase (NA) subtype combinations, with up to 26% of isolates showing evidence of mixed subtype infection. Through a phylogenetic analysis of the largest data set of AIV genomes compiled to date, we were able to document a remarkably high rate of genome reassortment, with no clear pattern of gene segment association and occasional inter-hemisphere gene segment migration and reassortment. From this, we propose that AIV in wild birds forms transient "genome constellations," continually reshuffled by reassortment, in contrast to the spread of a limited number of stable genome constellations that characterizes the evolution of mammalian-adapted influenza A viruses.


Conflict of interest statement

The authors have declared that no competing interests exist.

Figures

Figure 1
Figure 1. Maximum likelihood trees of HA and NA genes.
(a) Maximum likelihood tree of the HA gene segment of 452 isolates of avian influenza A virus, including representatives of all 16 subtypes. For clarity, all branches within individual subtypes have been collapsed and color-coded to signify individual subtypes. Bootstrap values above 70% are shown next to relevant branches. Branch lengths are scaled according to the number of nucleotide substitutions per site. See Figure S1 for an expanded form of this tree. (b) Maximum likelihood tree of the NA gene segment of 473 isolates of avian influenza A virus, including representatives of all 9 subtypes. The mix of HA subtypes (color-coded according to Figure 1a) observed within each NA type is shown, highlighting the frequency of reassortment. For clarity, all branches within individual subtypes have been collapsed. Bootstrap values above 65% are shown next to the relevant branches. Branch lengths are scaled according to the number of nucleotide substitutions per site. See Figure S2 for an expanded form of this tree, in which individual viral isolates are marked.
Figure 2
Figure 2. The genome constellations (internal gene segments only) of 5 H4N6 viruses collected from mallards at the same location in Ohio, USA on the same day.
The different colors reflect segments whose sequences fall into different major clades – defined by strong bootstrap support (>80%) – in each internal gene segment tree. For example, all 6 internal gene segments from isolates A/Mall/OH/655/2002 and A/Mall/OH/657/2002 have the same, shared phylogenetic position (shaded red), but exhibit a significantly different phylogenetic pattern, indicative of reassortment, with A/Mall/OH/667/2002 in the PB1 and PA gene segments (individual trees presented in Figures S4 and S5). Similarly, isolate A/Mall/OH/668/2002 shows phylogenetic evidence of reassortment in 5 of 6 internal gene segments compared to A/Mall/OH/655/2002.
Figure 3
Figure 3. Maximum likelihood analysis of congruence among the internal gene segments of 407 isolates of avian influenza virus.
Each column represents the difference in log likelihood (Δ-lnL) between the ML trees of each gene (shown by colored dots). In every case, the ML tree estimated for the reference gene has the highest likelihood, while lower likelihoods (greater Δ-lnL values) are observed when the ML trees for the other genes are fitted to the sequence data from the reference gene and branch lengths re-optimized. To assess the extent of similarity in topology among genes, 500 random trees were created for each data set and their likelihoods assessed for each gene in turn using the same procedure (indicated by horizontal bars). In every case, and most notably for NS, the trees inferred for each gene have likelihoods closer to the random set than to the ML tree for the reference gene, indicative of extensive incongruence.
Figure 4
Figure 4. The fitness landscapes of avian influenza virus.
(a) The fitness landscapes observed in HA, NA and NS, and represented here by NA. Each colored cone represents an individual subtype. These subtypes are connected by a bifurcating tree. The lack of ‘intermediate’ subtypes – those falling below the pink disc – reflects major valleys in fitness, such that any virus falling in this area will experience a major reduction in fitness, most likely due to an elevated cross-protective immune response. Occasionally, individual subtypes jump species barriers and spread in new hosts (such as humans), where they experience a continued selection pressure and hence accumulate amino acid substitutions in a progressive manner, as shown. (b) The fitness landscapes observed in the remaining internal protein segments of avian influenza virus – PB2, PB1, PA, NP and M (represented by different colors). In this case, there is little functional difference among the genetic variants of each segment, so that the fitness landscape is flat. This equivalence in fitness among genome constellations also means that reassortment is frequent among them (as reassortants suffer no fitness cost), represented by the horizontal lines connected each internal gene segment.

References

    1. Easterday BC, Trainer DO, Tumova B, Pereira HG. Evidence of infection with influenza viruses in migratory waterfowl. Nature. 1968;219:523–524. - PubMed
    1. Slemons RD, Johnson DC, Osborn JS, Hayes F. Type-A influenza viruses isolated from wild free-flying ducks in California. Avian Dis. 1974;18:119–124. - PubMed
    1. Webster RG, Bean WJ, Gorman OT, Chambers TM, Kawaoka Y. Evolution and ecology of influenza A viruses. Microbiol Rev. 1992;56:152–179. - PMC - PubMed
    1. Krauss S, Walker D, Pryor SP, Niles L, Chenghong L, et al. Influenza A viruses of migrating wild aquatic birds in North America. Vector Borne Zoonotic Dis. 2004;4:177–189. - PubMed
    1. Spackman E, Stallknecht DE, Slemons RD, Winker K, Suarez DL, et al. Phylogenetic analyses of type A influenza genes in natural reservoir species in North America reveals genetic variation. Virus Res. 2005;114:89–100. - PubMed

Publication types