

Inter-individual differences in habitual sleep timing and entrained phase of endogenous circadian rhythms of BMAL1, PER2 and PER3 mRNA in human leukocytes
- PMID: 18517031
- PMCID: PMC2398752
- DOI: 10.1093/sleep/31.5.608
Inter-individual differences in habitual sleep timing and entrained phase of endogenous circadian rhythms of BMAL1, PER2 and PER3 mRNA in human leukocytes
Abstract
Study objectives: Individual sleep timing differs and is governed partly by circadian oscillators, which may be assessed by hormonal markers, or by clock gene expression. Clock gene expression oscillates in peripheral tissues, including leukocytes. The study objective was to determine whether the endogenous phase of these rhythms, assessed in the absence of the sleep-wake and light-dark cycle, correlates with habitual sleep-wake timing.
Design: Observational, cross-sectional.
Setting: Home environment and Clinical Research Center.
Participants: 24 healthy subjects aged 25.0 +/- 3.5 (SD) years.
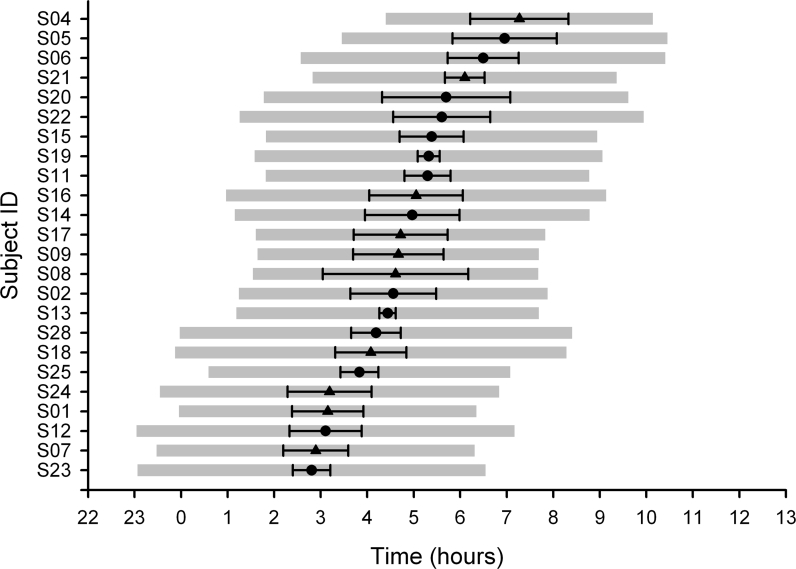
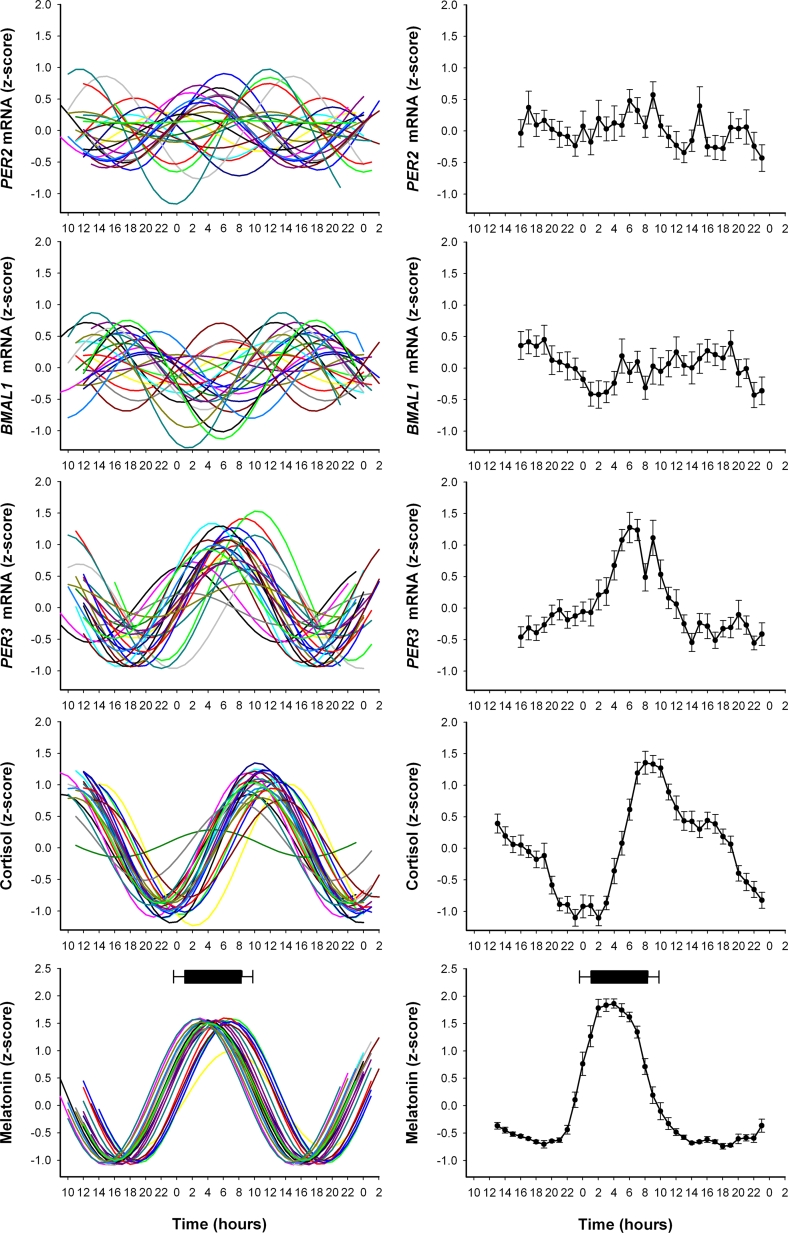
Measurements: Actigraphy and sleep diaries were used to characterize sleep timing. Circadian rhythm phase and amplitude of plasma melatonin, cortisol, and BMAL1, PER2, and PER3 expression were assessed during a constant routine.
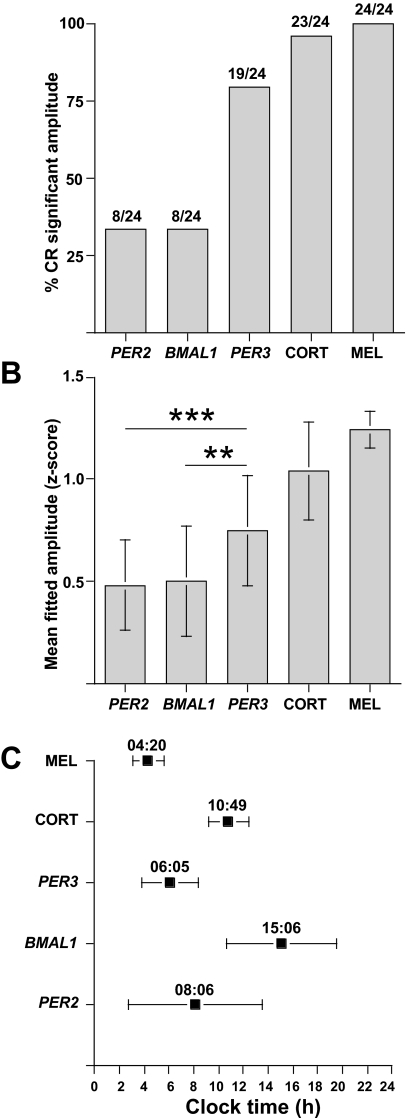
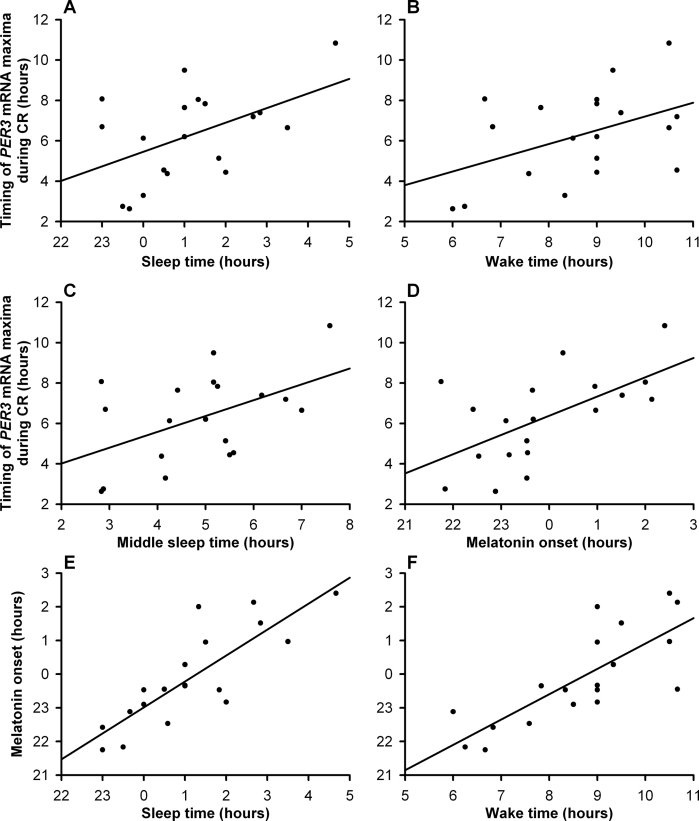
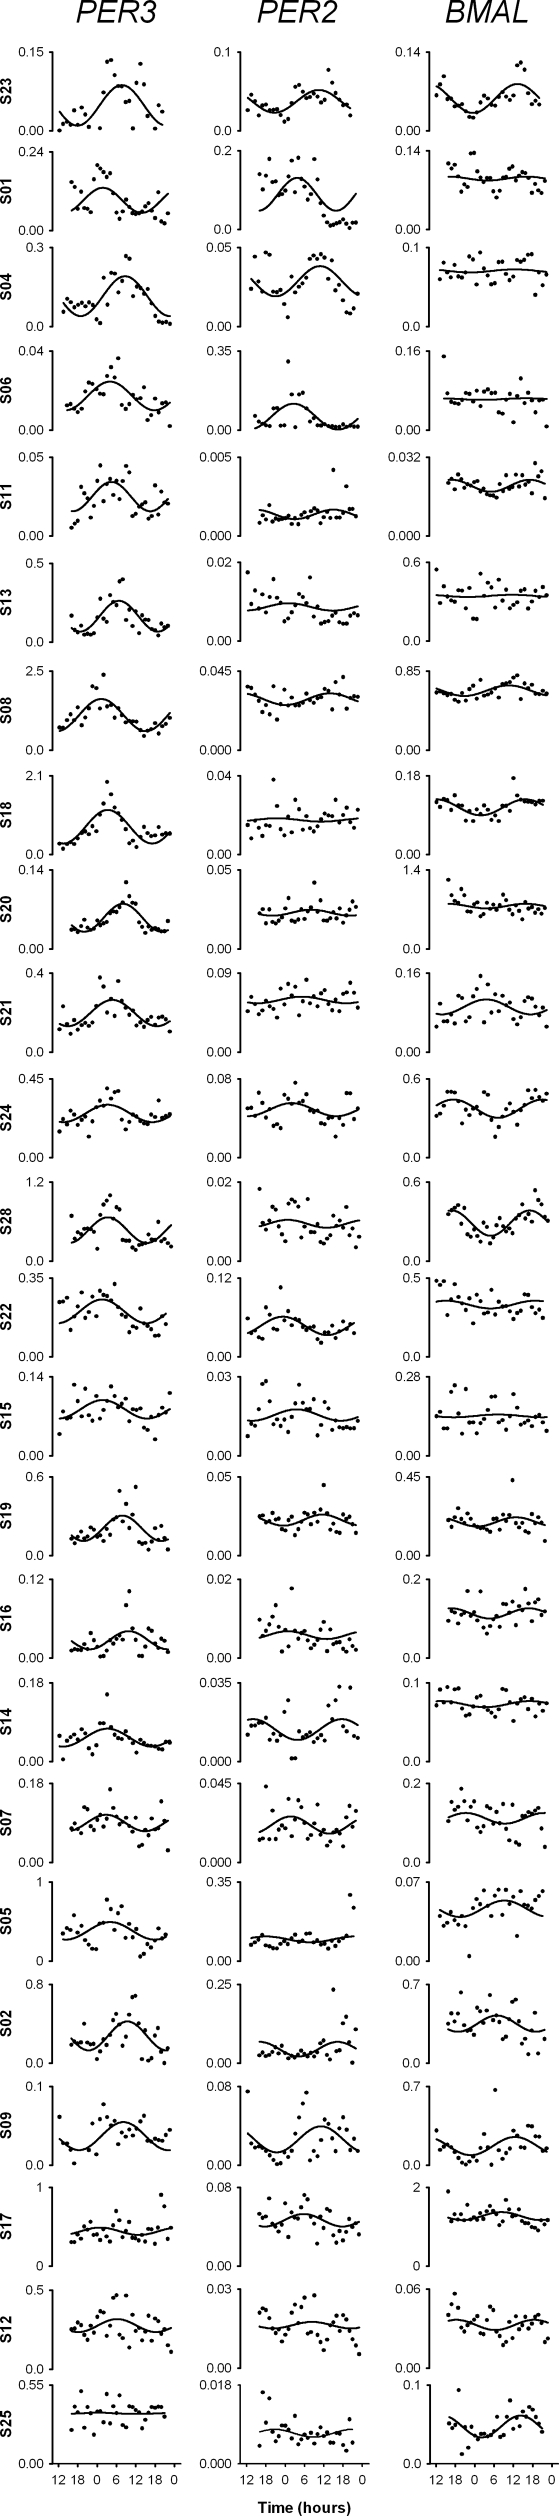
Results: Circadian oscillations were more robust for PER3 than for BMAL1 or PER2. Average peak timings were 6:05 for PER3, 8:06 for PER2, 15:06 for BMAL1, 4:20 for melatonin, and 10:49 for cortisol. Individual sleep-wake timing correlated with the phases of melatonin and cortisol. Individual PER3 rhythms correlated significantly with sleep-wake timing and the timing of melatonin and cortisol, but those of PER2 and BMAL1 did not reach significance. The correlation between sleep timing and PER3 expression was stronger in individuals homozygous for the variant of the PER3 polymorphism that is associated with morningness.
Conclusions: Individual phase differences in PER3 expression during a constant routine correlate with sleep timing during entrainment. PER3 expression in leukocytes represents a useful molecular marker of the circadian processes governing sleep-wake timing.
Figures
References
-
- Looby P, Loudon AS. Gene duplication and complex circadian clocks in mammals. Trends Genet. 2005;21:46–53. - PubMed
-
- von Schantz M, Jenkins A, Archer SN. Evolutionary history of the vertebrate period genes. J Mol Evol. 2006;62:701–7. - PubMed
-
- Dijk DJ, von Schantz M. Timing and consolidation of human sleep, wakefulness, and performance by a symphony of oscillators. J Biol Rhythms. 2005;20:279–90. - PubMed
-
- Tafti M, Franken P. Genetic dissection of sleep. J Appl Physiol. 2002;92:1339–47. - PubMed
-
- Aeschbach D, Sher L, Postolache TT, Matthews JR, Jackson MA, Wehr TA. A longer biological night in long sleepers than in short sleepers. J Clin Endocrinol Metab. 2003;88:26–30. - PubMed
Publication types
MeSH terms
Substances
Grants and funding
LinkOut - more resources
Full Text Sources
Other Literature Sources
