

Cold exposure and sleep in the rat: REM sleep homeostasis and body size
- PMID: 18517040
- PMCID: PMC2398761
- DOI: 10.1093/sleep/31.5.708
Cold exposure and sleep in the rat: REM sleep homeostasis and body size
Abstract
Study objectives: Exposure to low ambient temperature (Ta) depresses REM sleep (REMS) occurrence. In this study, both short and long-term homeostatic aspects of REMS regulation were analyzed during cold exposure and during subsequent recovery at Ta 24 degrees C.
Design: EEG activity, hypothalamic temperature, and motor activity were studied during a 24-h exposure to Tas ranging from 10 degrees C to -10 degrees C and for 4 days during recovery.
Setting: Laboratory of Physiological Regulation during the Wake-Sleep Cycle, Department of Human and General Physiology, Alma Mater Studiorum-University of Bologna.
Subjects: 24 male albino rats.
Interventions: Animals were implanted with electrodes for EEG recording and a thermistor to measure hypothalamic temperature.
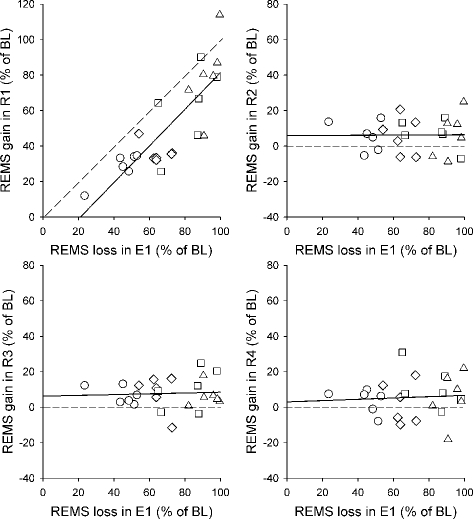
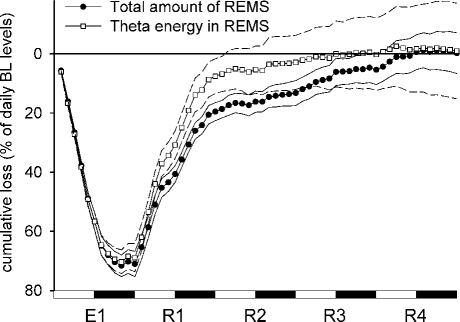
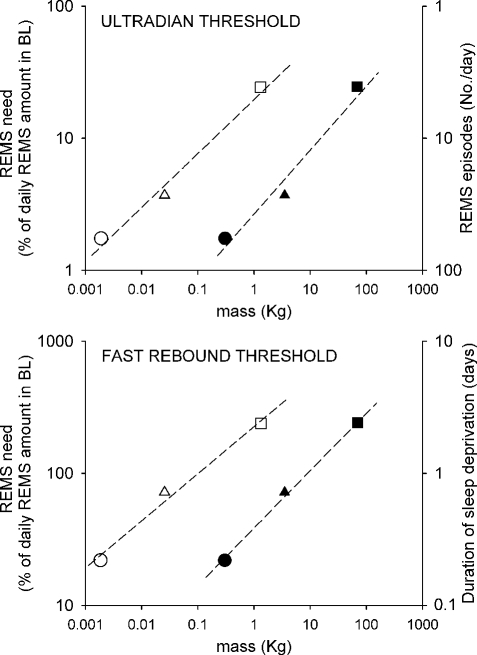
Measurements and results: REMS occurrence decreased proportionally with cold exposure, but a fast compensatory REMS rebound occurred during the first day of recovery when the previous loss went beyond a "fast rebound" threshold corresponding to 22% of the daily REMS need. A slow REMS rebound apparently allowed the animals to fully restore the previous REMS loss during the following 3 days of recovery.
Conclusion: Comparing the present data on rats with data from earlier studies on cats and humans, it appears that small mammals have less tolerance for REMS loss than large ones. In small mammals, this low tolerance may be responsible on a short-term basis for the shorter wake-sleep cycle, and on long-term basis, for the higher percentage of REMS that is quickly recovered following REMS deprivation.
Figures
References
-
- Borbély AA. Sleep: circadian rhythm versus recovery process. In: Koukkou M, Lehmann L, Angst J, editors. Functional states of the brain: Their determinants. Amsterdam: Elsevier; 1980. pp. 151–61.
-
- Borbély AA, Achermann P. Sleep homeostasis and models of sleep regulation. In: Kryger MH, Roth T, Dement WE, editors. Principles and practice of sleep medicine. Philadelphia: WB Saunders; 2005. pp. 405–17.
-
- Endo T, Schwierin B, Borbély AA, Tobler I. Selective and total sleep deprivation: effect on the sleep EEG in the rat. Psychiatry Res. 1997;66:97–110. - PubMed
-
- Endo T, Roth C, Landolt HP, et al. Selective REM sleep deprivation in humans: effects on sleep and sleep EEG. Am J Physiol. 1998;43:R1186–94. - PubMed
-
- Beersma DGM, Dijk DJ, Block CGH, Everhardus I. REM sleep deprivation during 5 hours leads to an immediate REM sleep rebound and to suppression of non-REM sleep intensity. Electroencephalogr Clin Neurophysiol. 1990;76:114–22. - PubMed
Publication types
MeSH terms
LinkOut - more resources
Full Text Sources
Miscellaneous
