. 2008 Jun 1;22(11):1445-50.
doi: 10.1101/gad.1663208.

Graded levels of Ptf1a differentially regulate endocrine and exocrine fates in the developing pancreas

Affiliations

Graded levels of Ptf1a differentially regulate endocrine and exocrine fates in the developing pancreas

P Duc Si Dong et al. Genes Dev. .

Abstract

The mechanisms regulating pancreatic endocrine versus exocrine fate are not well defined. By analyzing the effects of Ptf1a partial loss of function, we uncovered novel roles for this transcription factor in determining pancreatic fates. In a newly identified hypomorphic ptf1a mutant, pancreatic cells that would normally express ptf1a and become exocrine cells, express the endocrine marker Isl1, indicating a cell fate switch. Surprisingly, a milder reduction of Ptf1a leads to an even greater increase of ectopic endocrine cells, suggesting that Ptf1a also plays a role in promoting endocrine development. We propose that low levels of Ptf1a promote endocrine fate, whereas high levels repress endocrine fate and promote exocrine fate.


Figures
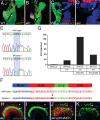
Figure 1.
Figure 1.
akreas is a hypomorphic allele of ptf1a. (A,B) Three-dimensional rendering of Tg(gutGFP) (green) wild-type (A) and akreas mutant (B) embryos at 56 hpf stained for Isl1 (red) and Insulin (Ins; blue) showing a smaller ventral pancreas (arrows) in akreas mutants. (C,D) Tg(elastase:GFP); Tg(lfabp:dsRed) wild-type (C) and akreas mutant (D) at 100 hpf stained for pan-Cadherin showing the absence of Tg(elastase:GFP) expression (green) in akreas mutants. Asterisks mark the EPD. (E) Genomic DNA sequence of wild-type and akreas mutant ptf1a showing the molecular lesion in the akreas ptf1a gene. (F) Schematic of the Ptf1a bHLH domain and corresponding amino acid sequences of wild-type and akreas mutant. (G) Luciferase assay to evaluate I142N substitution on Ptf1a transcriptional activity. Wild-type Ptf1a + E47 results in >100-fold induction of the reporter, while I142N Ptf1a results in a modest 40-fold induction. (H–K) Retina of 52 hpf Tg(ptf1a:eGFP); akreas mutant (H; green channel shown in I) and akreas mutant injected with ptf1aMO1 (J; green channel shown in K) stained for Isl1 (red) showing that Tg(ptf1a:eGFP)-expressing cells are restricted to the horizontal (white arrowheads) and amacrine (white arrows) layers in akreas mutants (H,I), but are scattered in ptf1aMO1-injected akreas mutants (J,K) indicating a more severe retina phenotype in the latter. Yellow arrows point to the photoreceptor cell layer. Blue arrows point to Tg(ptf1a:eGFP)/Isl1-coexpressing cells.
Figure 2.
Figure 2.
Ventral pancreas specification and outgrowth in akreas mutants. (A–H) Three-dimensional rendering of Tg(ptf1a:eGFP) (green) wild-type (A,B,E,F) and akreas mutant (C,D,G,H) embryos at 38 hpf (A–D) and 46 hpf (E–H) stained for Prox1 (red) and Nkx6.1 (blue) showing Tg(ptf1a:eGFP)-expressing pancreatic cells coexpressing Prox1 and Nkx6.1 (arrow) in wild-type but not akreas mutants at 38 hpf. Arrowheads point to Prox1 and Nkx6.1 expression in the dorsal pancreas. At 46 hpf, wild type and akreas mutants show Tg(ptf1a:eGFP) coexpression with Prox1 and Nkx6.1 (arrows) (E–H). Only red and blue channels are shown in B, D, F, and H (shown at higher magnification in Supplemental Fig. S2). (I,J) Three-dimensional rendering of 42 hpf Tg(gutGFP) (green) wild-type (I) and akreas mutant (J) embryos stained for Isl1 (red) showing a ventral pancreatic outgrowth in wild-type but not akreas mutants (arrows). (K,L) Three-dimensional rendering of 44 hpf Tg(gutGFP) (green) wild-type (K) and akreas mutant (L) embryos stained for Isl1 (red) and Ins (blue) showing the appearance of a small ventral pancreatic bud in akreas mutants (arrow). (M,N) Three-dimensional rendering of 80 hpf Tg(gutGFP) (green) wild-type (M) and akreas mutant (N) stained for Isl1 (red) and Ins (blue) showing that the ventral pancreas in akreas mutants can fuse (arrow) with the dorsal pancreas. (O,P) Wild-type (O) and akreas mutant (P) at 80 hpf stained for Nkx6.1 (red) and pan-Cadherin (green) showing Nkx6.1-positive cells marking the EPD (arrows), which does form in akreas mutants. L, liver.
Figure 3.
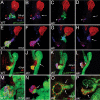
Figure 3.
Ptf1a represses endocrine development. (A–H,K,L) Tg(ptf1a:eGFP) (green) expression in wild-type (A,C,D,I) and akreas mutant (B,E–H,J) embryos stained for Isl1 (red) and pan-Cadherin (blue) show mutually exclusive expression of Tg(ptf1a:eGFP) and Isl1 in wild-type (except in a single cell; arrow) but not in akreas mutants at 50 hpf (A,B) and 80 hpf (C–H). (D) Tg(ptf1a:eGFP) intensity of C showing the single cell (arrow) with relatively low Tg(ptf1a:eGFP) expression. Note that most Tg(ptf1a:eGFP)/Isl1-coexpressing cells in akreas mutants are found at the distal EPD (E–H; arrows) where the Tg(ptf1a:eGFP) intensity is relatively high (H, GFP intensity of E) (shown at higher magnification in Supplemental Fig. S3A–F). (I,J) Tg(ptf1a:eGFP) (green) expression in 80 hpf wild type (I) and akreas mutants (J) stained for Isl1 (red) and Insulin (blue) show mutually exclusive expression of Tg(ptf1a:eGFP) and Insulin in wild-type and coexpression in akreas mutants (arrows). (K,L) At 140 hpf, Isl1 expression is no longer detectable in the principal endocrine cluster in wild-type (K), suggesting that Isl1 expression is lost from more mature endocrine cells. However, in akreas mutants (L), Isl1-positive cells, some of which coexpress Tg(ptf1a:eGFP) (arrows), are present, suggesting that endocrine neogenesis continues in akreas mutants. Asterisks mark the EPD.
Figure 4.
Figure 4.
Low levels of Ptf1a expression promote, whereas high levels repress, endocrine fate. (A–L) Tg(ptf1a:eGFP) expression (green) in control wild type (A–C) and ptf1aMO1 injected wild type (D–L) stained for Isl1 (red) and pan-Cadherin (blue). (A) Three-dimensional rendering of a 56 hpf control. (B,C) Z-focal plane of A at 2× magnification revealing mostly mutually exclusive expression of Tg(ptf1a:eGFP) and Isl1 in control with the exception of a single cell (arrows; red and blue channels in C). (D) Three-dimensional rendering of a 2 ng ptf1aMO1 injected wild type at 56 hpf. (E,F) Magnification (2×) of D shows ectopic Isl1-expressing cells all along the EPD (arrows; red and blue channels of E shown in F). (G,H) Two different Z-focal planes of E revealing extensive coexpression of Tg(ptf1a:eGFP) and Isl1 along the entire EPD (arrows; red and blue channels of H shown in I). (J) Three-dimensional rendering of a wild-type embryo injected with 0.5 ng of ptf1aMO1 at 76 hpf. (K) Z-focal plane of J showing a cluster of high level Tg(ptf1a:eGFP)-expressing cells that do not express Isl1 (arrowheads). (L) Tg(ptf1a:eGFP) intensity of K showing relatively high GFP expression in a cluster of cells that do not express Isl1 (K). (M,N) Three-dimensional rendering of ptf1aMO2 [which knocks down both Ptf1a and Tg(ptf1a:eGFP) expression] injected wild type at 76 hpf (M; green channel shown in N). (O–R) Z-focal plane through M showing that cells with higher levels of Tg(ptf1a:eGFP) expression (arrowheads) do not express Isl1. (P) Shows red and blue and (Q) shows green channels of O. Cells with relatively low levels of Tg(ptf1a:eGFP) expression (arrows) coexpress Isl1 (shown at higher magnification in Supplemental Fig. S3G–L). (R) Tg(ptf1a:eGFP) intensity of O.

References

    1. Ahlgren U., Pfaff S.L., Jessell T.M., Edlund T., Edlund H. Independent requirement for ISL1 in formation of pancreatic mesenchyme and islet cells. Nature. 1997;385:257–260. - PubMed
    1. Apelqvist A., Li H., Sommer L., Beatus P., Anderson D.J., Honjo T., de Hrabe Angelis M., Lendahl U., Edlund H. Notch signalling controls pancreatic cell differentiation. Nature. 1999;400:877–881. - PubMed
    1. Bertuzzi F., Marzorati S., Secchi A. Islet cell transplantation. Curr. Mol. Med. 2006;6:369–374. - PubMed
    1. Blanpain C., Horsley V., Fuchs E. Epithelial stem cells: Turning over new leaves. Cell. 2007;128:445–458. - PMC - PubMed
    1. Chiang M.K., Melton D.A. Single-cell transcript analysis of pancreas development. Dev. Cell. 2003;4:383–393. - PubMed

Publication types

MeSH terms

LinkOut - more resources