. 2008 Jun 1;22(11):1549-59.
doi: 10.1101/gad.461808.

Trans-regulation of the expression of the transcription factor MtHAP2-1 by a uORF controls root nodule development

Affiliations

Trans-regulation of the expression of the transcription factor MtHAP2-1 by a uORF controls root nodule development

Jean Philippe Combier et al. Genes Dev. .

Abstract

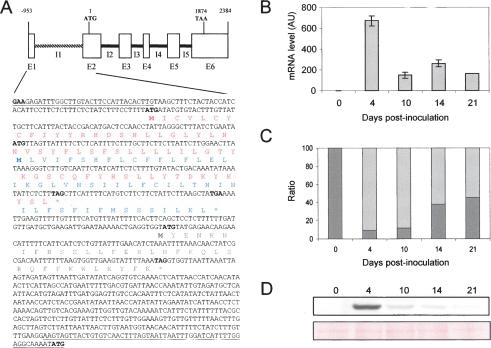
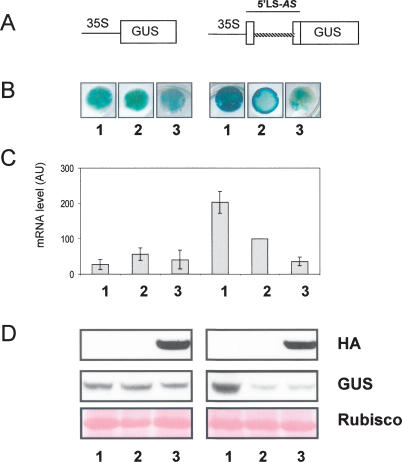
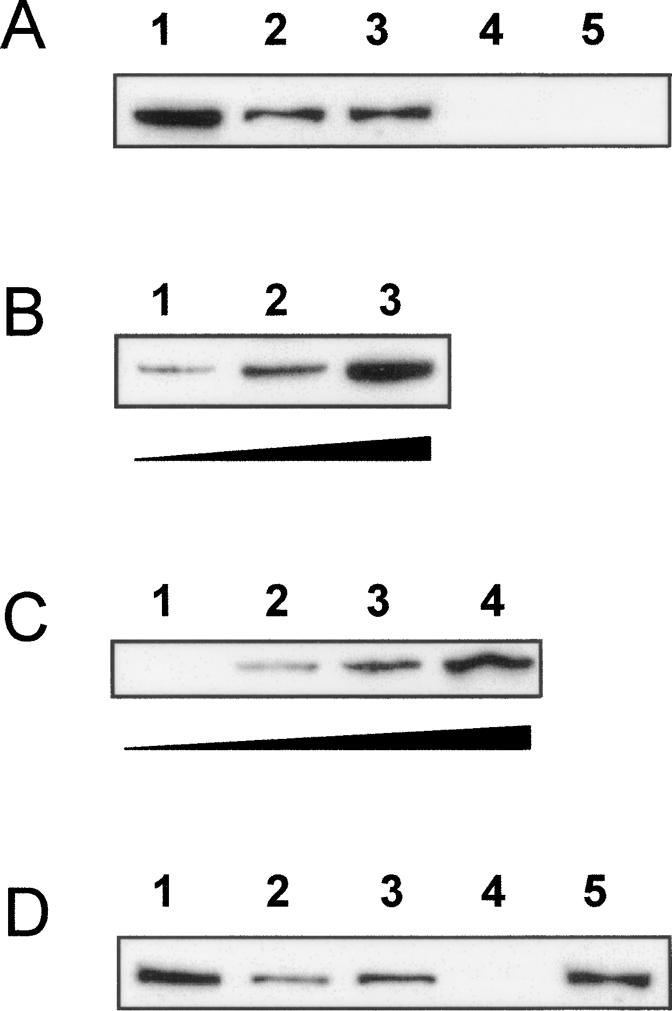
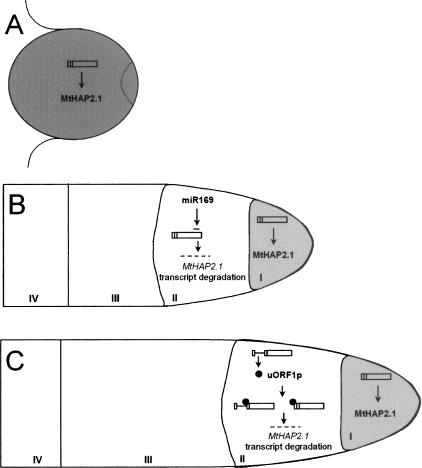
MtHAP2-1 is a CCAAT-binding transcription factor from the model legume Medicago truncatula. We previously showed that MtHAP2-1 expression is regulated both spatially and temporally by microRNA169. Here we present a novel regulatory mechanism controlling MtHAP2-1 expression. Alternative splicing of an intron in the MtHAP2-1 5'leader sequence (LS) becomes predominant during the development of root nodules, leading to the production of a small peptide, uORF1p. Our results indicate that binding of uORF1p to MtHAP2-1 5'LS mRNA leads to reduced accumulation of the MtHAP2-1 transcript and may contribute to spatial restriction of MtHAP2-1 expression within the nodule. We propose that miR169 and uORF1p play essential, sequential, and nonredundant roles in regulating MtHAP2-1 expression. Importantly, in contrast to previously described cis-acting uORFs, uORF1p is able to act in trans to down-regulate gene expression. Our work thus contributes to a better understanding of the action of upstream ORFs (uORFs) in the regulation of gene expression.


Figures

Figure 1.
Figure 1.
MtHAP2-1 intron 1 is alternatively spliced. (A) Schematic representation of MtHAP2-1 gene structure. Exons (E1–E6) are represented with boxes and introns (I1–I5) are shown as thick lines. MtHAP2-1 first intron (I1), shown with a discontinuous bar, is located in the 5′LS. Sequence of the 5′LS is shown at the bottom with exons E1 and E2 underlined. Deduced amino acid sequences of uORF1 (red), uORF2 (blue), and uORF3 (gray), are shown under the nucleotide sequence. (B) Expression analysis of MtHAP2-1 during nodule development. MtHAP2-1 transcript levels were determined by qRT–PCR with cDNA obtained from M. truncatula roots inoculated with S. meliloti at the indicated time points. The expression values were normalized using the expression level of MtEF1α as an internal standard (El Yahyaoui et al. 2004) and related to the value of MtHAP2-1 expression level before inoculation (0 dpi), which is set at 1. Mean expression values and SEM values were calculated from the results of three independent experiments. (C) qRT–PCR analysis of the expression levels of alternatively (dark gray) and normally spliced (light gray) MtHAP2-1 transcripts. The expression values were normalized using the expression level of MtEF1α as an internal standard and related to the value of the total MtHAP2-1 gene expression at each time point, which is set at 100%. (D) MtHAP2-1 protein expression analysis. (Top panel) Total proteins from nodules were extracted at the indicated time points, expressed in days after inoculation, and protein extracts (50 μg) were separated and analyzed by immunoblotting using anti-MtHAP2-1 polyclonal antibodies. (Bottom panel) Equal loading in each lane was confirmed by Ponceau S staining.
Figure 2.
Figure 2.
RNAiintron1 transgenic roots show a nodule growth defect. (A) Light microscopy images of longitudinal sections (50 μm) of nodules of M. truncatula transgenic roots expressing either an RNAiintron1 construct (right) or an empty-vector control (left). Pictures were taken 21 d after inoculation with S. meliloti. Bar, 100 μm. (B) MtHAP2-1 transcript levels were determined by qRT–PCR with cDNA obtained from empty-vector control, and RNAiintron1 M. truncatula nodules 21 d after inoculation with S. meliloti. The expression values were normalized using the expression level of MtEF1α as an internal standard and related to the value of the MtHAP2-1 transcript level in the RNAiintron1 transgenic plants, which is set at 100%. Mean expression values and SEM values were calculated from the results of two independent experiments. (C, top panel) Total proteins from empty-vector control and RNAiintron1 M. truncatula nodules were extracted 21 d after inoculation with S. meliloti, and protein extracts (50 μg) were analyzed by immunoblotting using anti-MtHAP2-1 polyclonal antibodies. (Bottom panel) Equal loading in both lanes was confirmed by Ponceau S staining.
Figure 3.
Figure 3.
uORF1 is expressed in the infection zone of mature nodules. Histochemical localization of β-glucuronidase (GUS) activity (A, red color) and nuclear staining using DAPI (B) of longitudinal sections of nodules from M. truncatula transgenic roots expressing a uORF1-GUS fusion construct. Dark-field (A) and fluorescence (B) microscopy images were taken 21 d after inoculation with S. meliloti. (B). Differentiated zones can be distinguished in the mature nodule after nuclear staining with DAPI (Vasse et al. 1990). (I) Meristematic zone. (II) Infection zone. (III) Nitrogen fixation zone. Bar, 50 μm.
Figure 4.
Figure 4.
Overexpression of uORF1 in roots leads to MtHAP2-1 degradation and a defect in nodule organogenesis. (A) Light microscopy images (50 μm) of longitudinal sections of nodules of M. truncatula transgenic roots expressing either a 35S:uORF1 construct (right) or an empty-vector control (left). Pictures were taken 21 d after inoculation with S. meliloti. Bar, 100 μm. (B) MtHAP2-1 transcript levels were determined by qRT–PCR with cDNA obtained from empty-vector control, 35S:uORF1 and RNAiMtHAP2-1 M. truncatula transgenic roots 5 d after inoculation with S. meliloti. The expression values were normalized using the expression level of MtEF1α as an internal standard and related to the value of the MtHAP2-1 transcript level in the control plants, which is set at 100%. Mean expression values and SEM values were calculated from the results of two independent experiments. (C, top panel) Total proteins from empty-vector control, 35S:uORF1 and RNAiMtHAP2-1 M. truncatula transgenic roots were extracted 5 d after inoculation with S. meliloti, and protein extracts (50 μg) were analyzed by immunoblotting using anti-MtHAP2-1 polyclonal antibodies. (Bottom panel) Equal loading was confirmed by Ponceau S staining.
Figure 5.
Figure 5.
uORF1p expression in N. benthamiana leaves leads to reduced levels of GUS fused to MtHAP2-1 5′LS-AS. Expression analysis of GUS (β-glucuronidase) 2 d after Agrobacterium-mediated transient expression of the GUS fusions shown in A together with either an empty vector control (1), untagged 35S:uORF1 (2), or 35S:uORF1-HA (3). (A) Schematic representation of the GUS fusions used in this experiment. MtHAP2-1 5′LS, containing the first intron (discontinuous line), was fused to the β-glucuronidase (GUS) gene under the control of the 35S promoter. (B) GUS expression determined by GUS histochemical staining of N. benthamiana leaf discs. (C) GUS transcript levels determined by qRT–PCR. The expression values were normalized using the expression level of NbEF1α as an internal standard and related to the expression value of 35S:5′LS-GUS + untagged 35S:uORF1, which is set at 100%. Mean expression values and SEM values were calculated from the results of seven independent experiments. (D) Western blot analysis showing GUS protein (middle panel) and uORF1-HA (top panel) expression levels. Ponceau S staining of ribulose-1,5-bisphosphate carboxylase/oxygenase (rubisco) for confirmation of equal loading in each lane is shown at the bottom.
Figure 6.
Figure 6.
uORF1p binds specifically to MtHAP2-1 5′LS RNA. Western Blots with an anti-HA antibody showing uORF1p-HA recovered after the RNA pull-down assays. (A, lane 1) Input of uORF1p-HA corresponds to 10% of the total N. benthamiana protein extract used for each binding assay. uORF1p-HA was eluted from the streptavidin beads after incubation with biotinylated MtHAP2-1 5′LS-AS-corresponding (lane 2) or MtHAP2-1-NS-corresponding (lane 3) RNA. uORF1p-HA was not eluted from the streptavidin beads after incubation with the biotinylated AtMYB30- (lane 4) or MtHAP2-1 Δ5′LS-corresponding RNA (lane 5). (B) Increasing amounts of total N. benthamiana protein extracts expressing uORF1p (1 mg, lane 1; 5 mg, lane 2; and 25 mg, lane 3) were used for the binding assay. uORF1p-HA was eluted from the streptavidin beads after incubation with biotinylated MtHAP2-1 5′LS-AS-corresponding RNA. (C) Increasing ratios of biotinylated to nonbiotinylated MtHAP2-1 5′LS-AS-corresponding RNA (0:1, lane 1; 1:3, lane 2; 1:1, lane 3; and 1:0, lane 4) were used for incubation with the streptavidin beads prior to binding of uORF1p-HA. (D) Competition experiment in which uORF1p was first bound to streptavidin beads containing a 1:1 mix of biotinylated to nonbiotinylated MtHAP2-1 5′LS-AS RNA (input of uORF1p, lane 1) prior to elution using MtHAP2-1 5′LS-AS (eluted uORF1p, lane 2) or AtMYB30 nonbiotinylated RNAs (eluted uORF1p, lane 4). The amount of uORF1p remaining on the beads after treatment with MtHAP2-1 5′LS-AS (lane 3) or AtMYB30 nonbiotinylated RNAs (lane 5) is also shown.
Figure 7.
Figure 7.
Model for regulation of MtHAP2-1 expression to orchestrate nodule development. (A) Four days after inoculation, the nodule structure is not well differentiated. miR169 and uORF1p not being expressed, MtHAP2-1 presents a higher expression level, evenly distributed throughout the nodule (data not shown). (B) Ten days after inoculation, miR169 is expressed in the nodule infection zone (II), leading to MtHAP2-1 transcript down-regulation and restricting MtHAP2-1 expression to the meristematic zone (I) and normal nodule growth (Combier et al. 2006). (C) Twenty-one days after inoculation, AS of MtHAP2-1 occurs, resulting in expression of uORF1p in the infection zone. uORF1p binding to the MtHAP2-1 transcript induces MtHAP2-1 transcript degradation, thereby restricting MtHAP2-1 expression to the meristematic zone of the nodule.

References

    1. Ardourel M., Demont N., Debelle F., Maillet F., de Billy F., Prome J.C., Denarie J., Truchet G. Rhizobium meliloti lipooligosaccharide nodulation factors: Different structural requirements for bacterial entry into target root hair cells and induction of plant symbiotic developmental responses. Plant Cell. 1994;6:1357–1374. - PMC - PubMed
    1. Baek D., Green P. Sequence conservation, relative isoform frequencies, and nonsense-mediated decay in evolutionarily conserved alternative splicing. Proc. Natl. Acad. Sci. 2005;102:12813–12818. - PMC - PubMed
    1. Ben-Naim O., Eshed R., Parnis A., Teper-Bamnolker P., Shalit A., Coupland G., Samach A., Lifschitz E. The CCAAT binding factor can mediate interactions between CONSTANS-like proteins and DNA. Plant J. 2006;46:462–476. - PubMed
    1. Bhattacharya A., Deng J.M., Zhang Z., Behringer R., de Crombrugghe B., Maity S.N. The B subunit of the CCAAT box binding transcription factor complex (CBF/NF-Y) is essential for early mouse development and cell proliferation. Cancer Res. 2003;63:8167–8172. - PubMed
    1. Blencowe B.J. Alternative splicing: New insights from global analyses. Cell. 2006;126:37–47. - PubMed

Publication types

MeSH terms

Substances

LinkOut - more resources