. 2008 Jun 9;205(6):1343-55.
doi: 10.1084/jem.20071572. Epub 2008 Jun 2.

A unique B2 B cell subset in the intestine

Affiliations

A unique B2 B cell subset in the intestine

Yasuyo Shimomura et al. J Exp Med. .

Abstract

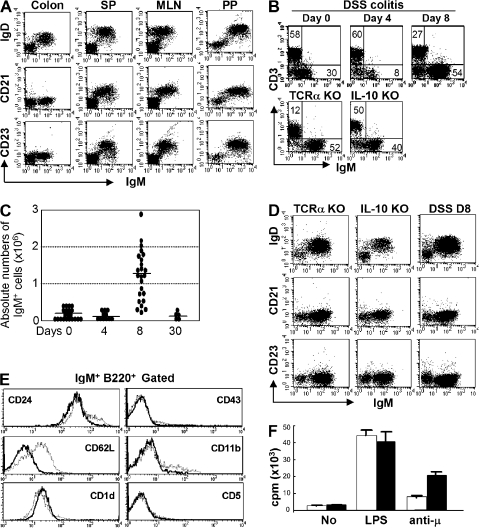
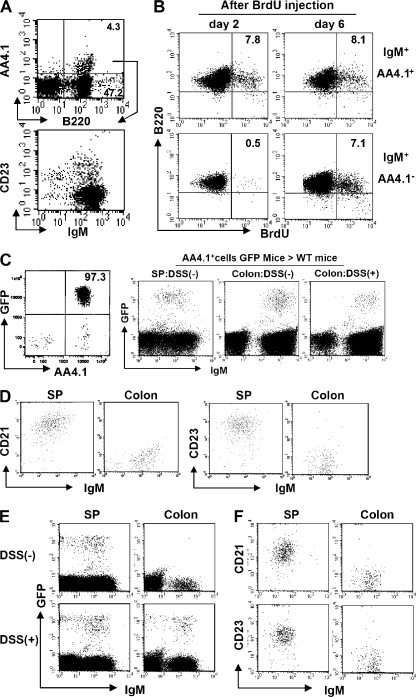
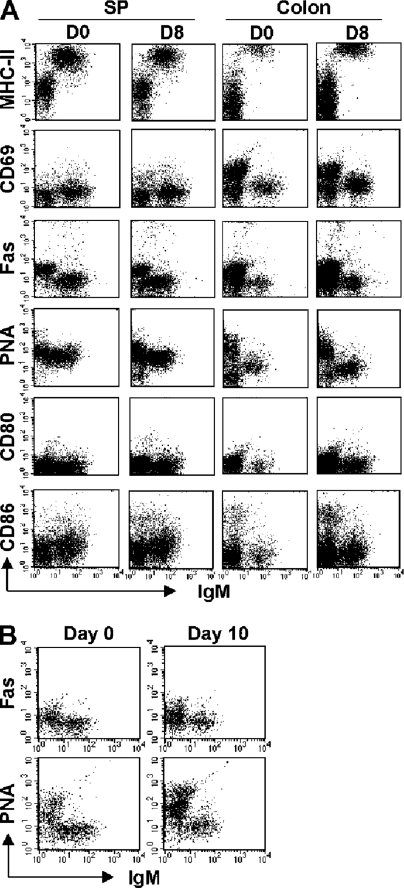
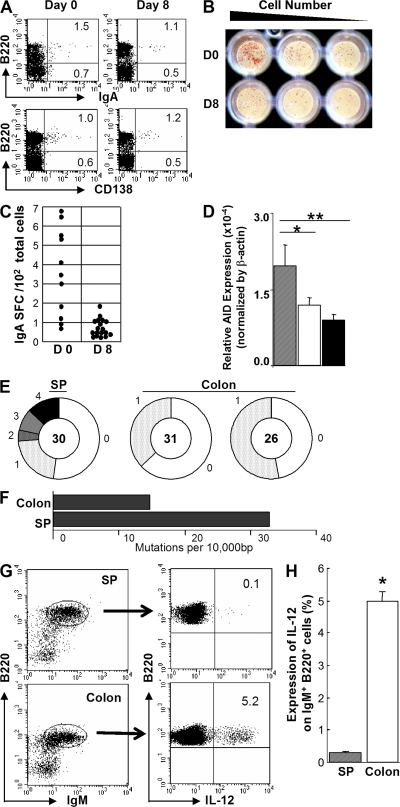
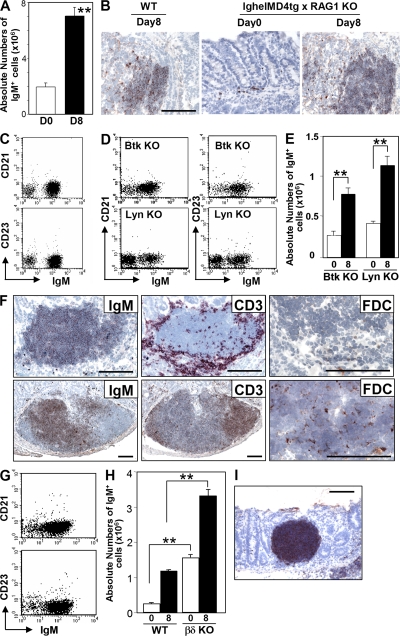
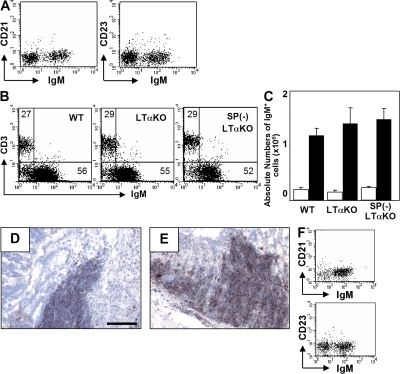
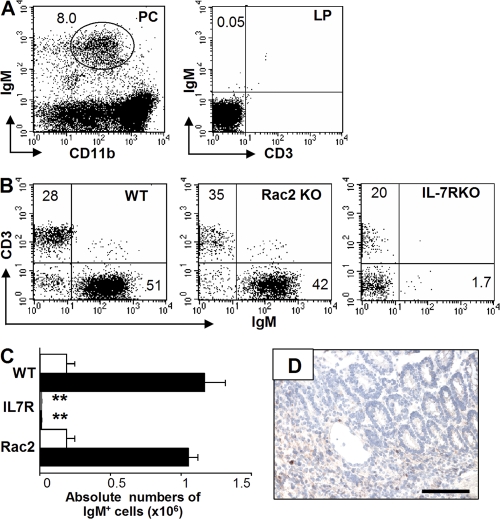
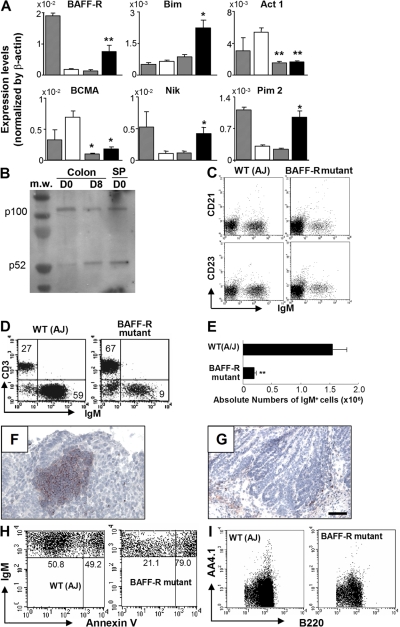
Over 80% of the body's activated B cells are located in mucosal sites, including the intestine. The intestine contains IgM(+) B cells, but these cells have not been characterized phenotypically or in terms of their developmental origins. We describe a previously unidentified and unique subset of immunoglobulin M(+) B cells that present with an AA4.1(-)CD21(-)CD23(-) major histocompatibility complex class II(bright) surface phenotype and are characterized by a low frequency of somatic hypermutation and the potential ability to produce interleukin-12p70. This B cell subset resides within the normal mucosa of the large intestine and expands in response to inflammation. Some of these intestinal B cells originate from the AA4.1(+) immature B2 cell pool in the steady state and are also recruited from the recirculating naive B cell pool in the context of intestinal inflammation. They develop in an antigen-independent and BAFF-dependent manner in the absence of T cell help. Expansion of these cells can be induced in the absence of the spleen and gut-associated lymphoid tissues. These results describe the existence of an alternative pathway of B cell maturation in the periphery that gives rise to a tissue-specific B cell subset.


Figures

Figure 1.
Figure 1.
Identification of a unique IgM+ B cell subset in the large intestine. (A) Expressions of IgM versus IgD, CD21, or CD23 of the cells from colon, spleen (SP), MLN, and PP of WT mice are shown. (B) For DSS colitis, intestinal inflammation was induced by administration of 4% DSS in drinking water, and the treatment was terminated by changing DSS water to normal water at day 4. (top) Proportions of IgM versus CD3ε-expressing cells in the large intestine from normal mice (Day 0, n = 21) and DSS-induced colitis mice (Day 4 [acute phase], n = 11; Day 8 [recovery phase], n = 24). (bottom) Proportions of IgM versus CD3ε-expressing cells in the large intestine of chronic colitis models, TCRα KO mice (n = 3), and IL-10 KO mice (n = 3). (C) Absolute numbers of IgM+ cells in the large intestine of DSS colitis at day 0, 4, 8, and 30 are shown. (D) Expressions of IgM versus CD23, CD21, or IgD on the cells from large intestine of three colitis models (DSS colitis, TCRα KO mice, and IL-10 KO mice) are shown. The data are representative of 3–11 individual experiments. (E) Expression of several surface makers on the gated IgM+ B220+ cells from the large intestine of DSS at day 8 (solid lines) and from spleen (dot lines) is shown. The data are representative of 11 individual experiments. (F) Proliferative responses of purified B cells (>95% are IgM+) from the colon (shaded bars) and spleen (open bars) to stimulation without (No) or with LPS (5 μg/ml) or F(ab')2 anti-Igμ Abs (anti-μ; 50 μg/ml) are shown. The results represent the mean ± the SEM of triplicate data from three individual mice.
Figure 2.
Figure 2.
Direct maturation of AA4.1+ immature B cells to AA4.1 intestinal B cells. (A) Intestinal inflammation was induced by administration of 4% DSS in drinking water and the treatment was terminated by changing the DSS-containing water to normal water at day 4. Expression of AA4.1 versus B220 (top) in total large intestinal cells (day 8) and CD23 versus IgM expression on the gated AA4.1+ B220+ cells (bottom; n = 12) is shown. (B) 1 mg BrdU was administered (intraperitoneally) into intact WT mice twice with a 24-h interval between injections, and the mice were killed at 2 and 6 d after initial BrdU injection. The B220 versus BrdU expressions on the gated AA4.1+ (top) or AA4.1 (bottom) IgM+ cells from large intestine are shown. The data are representative of three individual experiments. (C and D) Purified AA4.1+ B220+ B cells from the spleen of GFP transgenic mice (left) were intravenously transferred into WT mice with or without prior DSS exposure. 6 d after cell transfer, the recipient mice were killed. GFP- and IgM-expressing B cells in the recipient colon and spleen were identified (C). The expression of CD21 and CD23 versus IgM on the gated GFP+ cells in the spleen and colon of recipient mice without DSS treatment is shown in D. The data are representative of three to six individual recipients/group. (E and F) Purified IgDhigh B cells from the spleen of GFP transgenic mice were intravenously transferred into WT mice that had being treated without (top) or with DSS (bottom). 4 d after cell transfer, the recipient mice were killed. The expressions of GFP versus IgM in recipient spleen (left) and colon (right) are shown in (E). The expressions of CD21 or CD23 on the gated GFP+ cells from the spleen (left) and large intestine (right) of DSS treated mice are shown in (F). The data are representative of three individual recipients.
Figure 3.
Figure 3.
Unique activated status of intestinal IgM+ B cells. (A) Expressions of IgM versus MHC class II, CD69, Fas, PNA, CD80, or CD86 in cells of the spleen and colon from WT mice (Day 0) and WT mice during recovery phase of DSS colitis (Day 8) are shown. The data are representative of three individual mice. (B) Mice were infected with C. rodentium and killed 6 and 10 d after infection. Expressions of IgM versus PNA or Fas on cells from the normal colon (left) and the infected colon (right) are shown. The data are representative of three individual mice/group. Representative expression patter was observed on the intestinal B cells 6 d after infection (not depicted).
Figure 4.
Figure 4.
Large intestinal IgM+ B cells are characterized by low frequency of SHM and by production of IL-12 in response to CpG. (A) Expressions of IgA and CD138 versus B220 on large intestinal cells from day 0 (n = 6) and day 8 (n = 6) of DSS colitis are shown. (B and C) ELISPOT assay shows the number of IgA-secreting cells among total large intestinal cells at day 0 and 8 of DSS colitis (B). The data are summarized in C. (D) Expressions of activation-induced deaminase in purified B cells from the colon of day 0 (open bar, n = 16) and day 8 (gray bar, n = 15) after DSS treatment and from the spleen of day 0 (black bar, n = 8) are shown. *, P < 0.1; **, P < 0.05. (E) Analysis of sequences with mutations (splenic and colonic IgM+ B cells of normal WT mice) is depicted by pie charts. Numbers outside of each pie chart are the number of mutations/clone. The size of the wedge is proportional to the percentage of clones carrying that number of mutations. Inside each inner circle is the number of clones sequenced. Data from an individual spleen (as control) and two different normal large intestines are shown. (F) Mutation frequencies are calculated by the number of mutations per 104 bp from splenic and large intestinal IgM+ B cells of WT mice. (G) Cells from the normal large intestine and spleen of WT mice were stimulated with 1 μM CpG for 17 h, including a 7-h culture period with GolgiStop. The stimulated cells were subjected to surface staining for detection of IgM and B220 and intracellular staining for detection of IL-12p70. Expression of IL-12p70 in the gated IgM+B220+ cell population is shown. (H) The mean percentage of IL-12–producing cells among IgM+ B cells from the large intestine (n = 6) and spleen (n = 6) of WT mice is shown. *, P < 0.001.
Figure 5.
Figure 5.
Development of intestinal CD21CD23 B cells through BCR-independent response without T cell help. (A) Absolute number of IgM+ cells in the large intestine from lghelMD4 tg x RAG1 KO mice at day 0 (normal, open bar; n = 10) and day 8 (recovery phase of DSS colitis, shaded bar; n = 10) are shown. (B) Colonic tissues from WT mice at day 8 and from lghelMD4 tg x RAG1 KO mice at days 0 and 8 were subjected to immunohistochemical analysis for the detection of IgM+ cells. The findings are representative of >12 individual experiments. (C) Expressions of IgM versus CD21 or CD23 on the gated B220+ cells of normal large intestine (Day 0) from lghelMD4 tg x RAG1 KO mice are shown. (D) Expressions of IgM versus CD21 or CD23 on the gated B220+ cells from normal large intestine of Btk KO mice (n = 5) and Lyn KO mice (n = 5) are shown. (E) Absolute numbers of large intestinal IgM+ cells from Btk KO and Lyn KO mice at day 0 (normal, open bar, n = 5) and day 8 of DSS colitis (recovery, solid bar, n = 5–7) are shown. (F) Inflamed intestinal mucosa (Day 8 of DSS colitis, top) and colonic patch within normal mucosa (bottom) of WT mice were subjected to immunohistochemical analysis for the detection of IgM (left), CD3 (middle), and FDC (right). (G) Expressions of IgM versus CD21 or CD23 on the gated B220+ cells of the normal large intestine from TCRβδ DKO mice are shown. (H) Absolute numbers of IgM+ cells in the large intestine of WR and TCRβδ DKO mice at day 0 (normal, open bar, n = 5–7) and day 8 (recovery of DSS colitis, solid bar; n = 5–7) are shown. (I) Large intestinal tissues of TCRβδ DKO mice at day 8 of DSS colitis were subjected to immunohistochemical analysis for the detection of IgM+ cells. Statistical significances are indicated in by ** (P < 0.001). Bars, 100 μm.
Figure 6.
Figure 6.
Intestinal CD21CD23 B cell development is independent of spleen and organization lymphoid tissues. Intestinal inflammation was induced in WT (Day 0, n = 8; Day 8, n = 8) and LTα KO (Day 0, n = 5; Day 8, n = 5) and splenectomized LTα (SP[-] LTα; Day 0, n = 5; Day 8, n = 5) mice. (A) Expressions of IgM versus CD21 or CD23 on large intestinal cells from LTα KO mice are shown. (B) Proportions (IgM/CD3ε) in large intestinal cells at day 8 are shown. (C) Absolute numbers of large intestinal IgM+ cells at day 0 (normal, open bar) and day 8 (recovery, shaded bar) are shown. (D and E) The inflamed intestine from LTα KO (D) and splenectomized LTα KO (E) mice were subjected to immunohistochemical analysis for the detection of IgM+ cells. (F) Expressions of IgM versus CD21 or CD23 on the gated B220+ cells from the normal colon (Day 0) of splenectomized LTα KO mice are shown. Bars, 100 μm.
Figure 7.
Figure 7.
Intestinal CD21CD23 IgM+ B cells are not associated with B1 lineage cell. (A) RAG1 KO mice that had been reconstituted with peritoneal B1 cells from WT mice were treated with 4% DSS for 4 d and killed at day 8. The DSS-treated recipient mice show sufficient reconstitution of CD11blow IgM+ B 1 cells in the peritoneal cavity (PC, left), whereas no IgM+ B cells are detectable in the inflamed mucosa (LP, right) of these mice. The data are representative of four individual recipient mice. (B–D) Intestinal inflammation was induced in WT (Day 0, n = 6; Day 8, n = 6), Rac2 KO (Day 0, n = 5; Day 8, n = 5), and IL-7Rα KO (Day 0, n = 5; Day 8, n = 5) mice by oral administration of 4% DSS for 4 d. Proportion (IgM/CD3ε) at day 8 (B) and absolute number of IgM+ cells in the large intestine at day 0 (normal, open bar) and day 8 (recovery, shaded bar; C) are shown. The large intestine from IL-7Rα KO mice at day 8 was subjected to immunohistochemical analysis for detection of IgM+ cells (D). Presence of statistical significance (P < 0.001) compared with day 8 WT mice is indicated by **. Bars, 100 μm.
Figure 8.
Figure 8.
Requirement of BAFF-R–mediated signaling for intestinal CD21CD23 B cell development. (A) Expressions of BAFF signaling-related molecules in purified B cells from the large intestine of day 0 (open bars), 4 (gray bars), and 8 (black bars) after DSS treatment and from the spleen of day 0 (hatched bars) are shown. The results represent the means ± the SD from six individual mice in each group. *, P < 0.00 1 (comparison between colonic B cells at day 0 versus day 8). (B) Western blot analysis shows the expression levels of NF-κB2 p100 and p52 in purified B cells (>97% are IgM+) of the large intestine from 4–30 pooled WT mice at day 0 (D0, normal) and 8 (D8, recovery of DSS colitis), and of the spleen from day 0. The data are representative of two individual experiments. (C) Expressions of IgM versus CD21 or CD23 on the gated B220+ cells from normal large intestine of control and BAFF-R mutant mice are shown. (D–G) Intestinal inflammation was induced in BAFF-R mutant (A/WySnJ; Day 0, n = 5; Day 8, n = 16) and control (A/J) mice (Day 0, n = 5; Day 8, n = 10) by oral administration of 4% DSS for 4 d. (D and E) Proportion (CD3/IgM; D) and absolute numbers of IgM+ B cells (E) in the colon of control and BAFF-R mutant mice at day 8 of DSS colitis are shown. Presence of statistically significant (P < 0.001) compared with control mice at day 8 is indicated by **. (F and G) Large intestine from control mice (F) and BAFF-R mutant mice (G) at day 8 were subjected to immunohistochemical analysis for the detection of IgM+ cells. (H) Apoptosis of intestinal IgM+ B cells in control mice and BAFF-R mutant mice at day 8 of DSS colitis as judged by Annexin V staining is shown. The mean percentages of Annexin V+ cells among IgM+ cells are 36.6 ± 1.09% in control mice (n = 7) and 75.6 ± 1.64% in BAFF-R mutant mice (n = 7; P < 0.001). (I) Expression of AA4.1 versus B220 on the cells from normal intestine of control (left) and BAFF-R mutant (right) are shown. Bars, 100 μm.

Comment in

References

    1. Hardy, R.R., and K. Hayakawa. 2001. B cell development pathways. Annu. Rev. Immunol. 19:595–621. - PubMed
    1. Su, T.T., B. Guo, B. Wei, J. Braun, and D. Rawlings. 2004. Signaling in transitional type 2 B cells is critical for peripheral B-cell development. Immunol. Rev. 197:161–178. - PubMed
    1. Allman, D., B. Srivastava, and R.C. Lindsley. 2004. Alternative routes to maturity: branch points and pathways for generating follicular and marginal zone B cells. Immunol. Rev. 197:147–160. - PubMed
    1. Cancro, M.P. 2004. Peripheral B-cell maturation: the intersection of selection and homeostasis. Immunol. Rev. 197:89–101. - PubMed
    1. Pillai, S., A. Cariappa, and S. Moran. 2005. Marginal zone B cells. Annu. Rev. Immunol. 23:161–196. - PubMed

Publication types