. 2008 Jun 1;68(11):4331-9.
doi: 10.1158/0008-5472.CAN-08-0943.

Carcinoma-associated fibroblast-like differentiation of human mesenchymal stem cells

Affiliations

Carcinoma-associated fibroblast-like differentiation of human mesenchymal stem cells

Pravin J Mishra et al. Cancer Res. .

Abstract

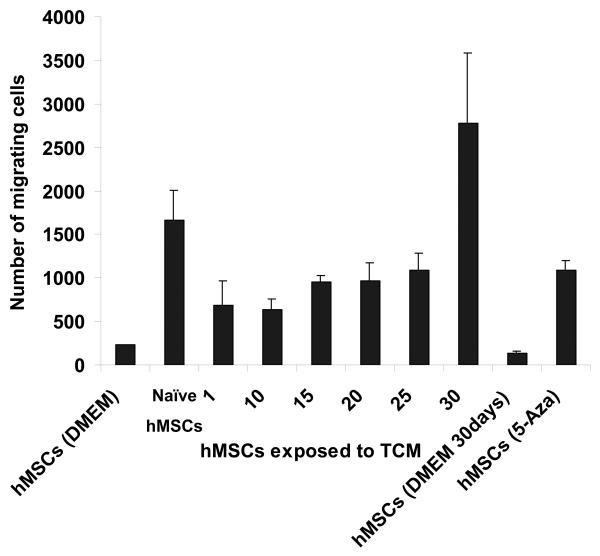
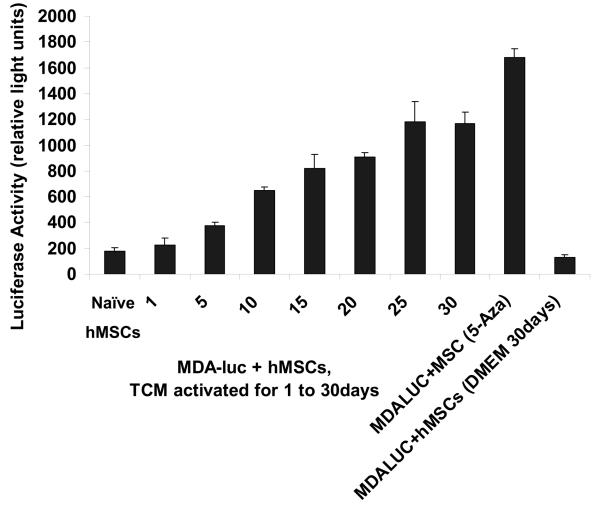
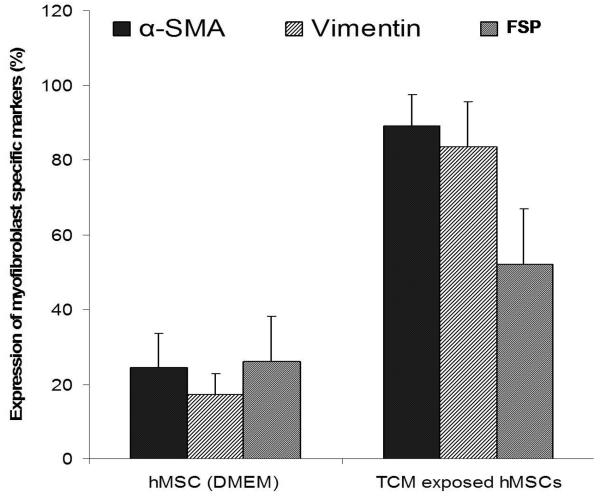
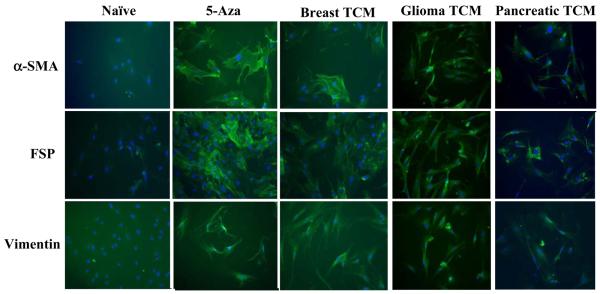
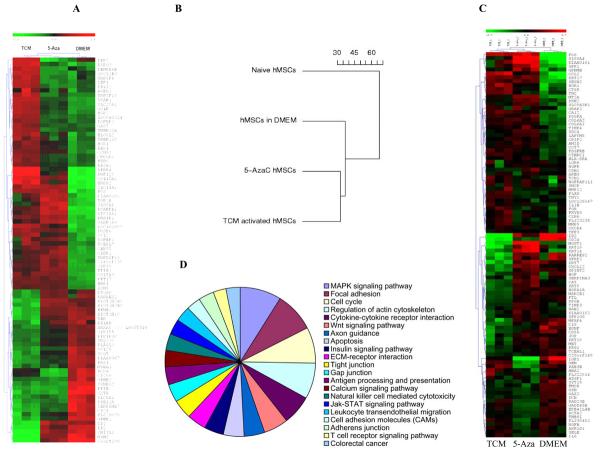
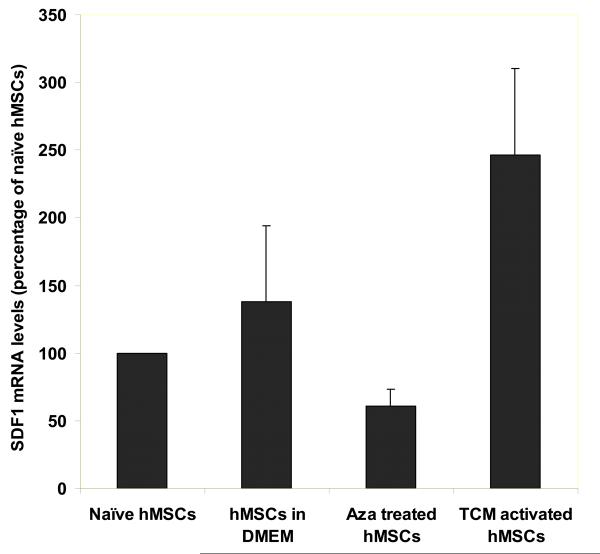
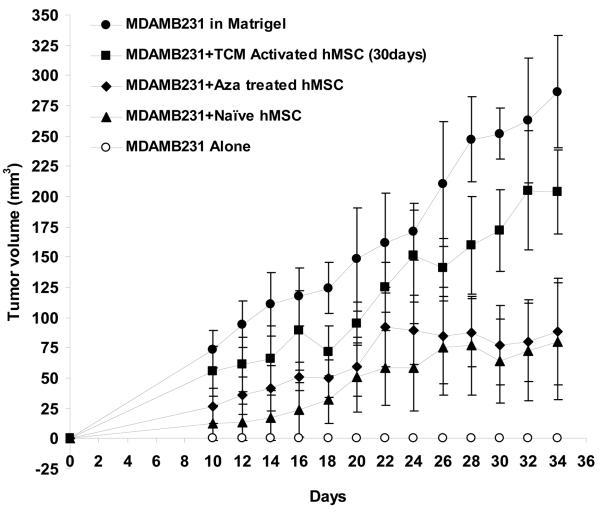
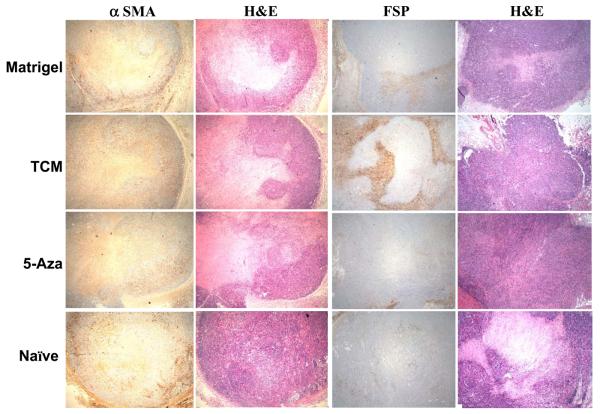
Carcinoma-associated fibroblasts (CAF) have recently been implicated in important aspects of epithelial solid tumor biology, such as neoplastic progression, tumor growth, angiogenesis, and metastasis. However, neither the source of CAFs nor the differences between CAFs and fibroblasts from nonneoplastic tissue have been well defined. In this study, we show that human bone marrow-derived mesenchymal stem cells (hMSCs) exposed to tumor-conditioned medium (TCM) over a prolonged period of time assume a CAF-like myofibroblastic phenotype. More importantly, these cells exhibit functional properties of CAFs, including sustained expression of stromal-derived factor-1 (SDF-1) and the ability to promote tumor cell growth both in vitro and in an in vivo coimplantation model, and expression of myofibroblast markers, including alpha-smooth muscle actin and fibroblast surface protein. hMSCs induced to differentiate to a myofibroblast-like phenotype using 5-azacytidine do not promote tumor cell growth as efficiently as hMSCs cultured in TCM nor do they show increased SDF-1 expression. Furthermore, gene expression profiling revealed similarities between TCM-exposed hMSCs and CAFs. Taken together, these data suggest that hMSCs are a source of CAFs and can be used in the modeling of tumor-stroma interactions. To our knowledge, this is the first report showing that hMSCs become activated and resemble carcinoma-associated myofibroblasts on prolonged exposure to conditioned medium from MDAMB231 human breast cancer cells.


Figures

Figure 1
Figure 1
30d TCM exposed hMSCs migrate towards and support the growth of tumor cells and express markers for myofibroblast lineage. A, Figure shows increased number of 30d TCM exposed hMSCs migrating toward the MDAMB231 cells placed at the bottom of the transwell chamber as compared with naïve MSCs or the 5-aza treated cells. Interestingly, hMSCs exposed to TCM for periods up to 25 days did not show an increase in number of migrating cells as compared to the number of migrating naïve hMSCs. Migration of 30d TCM exposed cells were significantly increased as compared naïve hMSCs (p=0.003) as well as to all other cell types (p<0.005). B, Increase in luciferase activity reflects growth of MBA-luc cells in a mixed culture assay. Luciferase activity was measured to determine growth of MDA-luc cells in the coculture assay. 5-aza treated hMSCs promote growth of MDAMB231 human breast cancer cells in vitro as compared to naïve hMSCs. 1 and 5d TCM-exposed hMSCs do not increase growth of MDAMB231 cells. A significant increase is observed with d10-d20 TCM hMSCs and an additional increase is seen with d25 & d30 TCM exposed hMSCs. C, The quantitative expression of myofibroblast marker proteins α-SMA, FSP and vimentin in naïve hMSCs and 30d breast cancer TCM activated hMSCs were analyzed by immunofluorescence staining (see methods for details).
Figure 1
Figure 1
30d TCM exposed hMSCs migrate towards and support the growth of tumor cells and express markers for myofibroblast lineage. A, Figure shows increased number of 30d TCM exposed hMSCs migrating toward the MDAMB231 cells placed at the bottom of the transwell chamber as compared with naïve MSCs or the 5-aza treated cells. Interestingly, hMSCs exposed to TCM for periods up to 25 days did not show an increase in number of migrating cells as compared to the number of migrating naïve hMSCs. Migration of 30d TCM exposed cells were significantly increased as compared naïve hMSCs (p=0.003) as well as to all other cell types (p<0.005). B, Increase in luciferase activity reflects growth of MBA-luc cells in a mixed culture assay. Luciferase activity was measured to determine growth of MDA-luc cells in the coculture assay. 5-aza treated hMSCs promote growth of MDAMB231 human breast cancer cells in vitro as compared to naïve hMSCs. 1 and 5d TCM-exposed hMSCs do not increase growth of MDAMB231 cells. A significant increase is observed with d10-d20 TCM hMSCs and an additional increase is seen with d25 & d30 TCM exposed hMSCs. C, The quantitative expression of myofibroblast marker proteins α-SMA, FSP and vimentin in naïve hMSCs and 30d breast cancer TCM activated hMSCs were analyzed by immunofluorescence staining (see methods for details).
Figure 2
Figure 2
Increased expression of myofibroblast marker proteins α-SMA, FSP and vimentin was observed in hMSCs exposed to TCM from breast, glioma and pancreatic cancers, and in 5-aza treated hMSCs by immunofluorescence staining. All samples were counterstained with DAPI to visualize nuclei and appear blue in the photographs.
Figure 3
Figure 3
Comparative gene expression analysis of 30d TCM exposed hMSCs, 5-aza treated hMSCs and control DMEM exposed hMSCs. A, Global gene expression profile of control DMEM exposed hMSCs, 5-aza treated hMSCs and 30d TCM exposed hMSCs. The hierarchical clustering is obtained from cDNA microarray studies carried out on naïve, 5aza treated hMSCs and tumor conditioned medium treated hMSCs for 30 days. Overall gene expression profiles of 5-aza treated hMSCs and 30d TCM-exposed hMSCs are similar. Control DMEM exposed hMSCs have a different expression profile from both 5-aza treated as well as 30d TCM exposed hMSCs. The expression levels of individual transcripts are shown from green (low) to red (high). Clustering reveals an overall global gene expression profile similarity between 5-aza treated hMSCs and 30d TCM exposed hMSCs as compared to the control 30dDMEM exposed (green: lower expression and red: higher expression). There are several candidate genes that show increased expression in only the 30d TCM exposed hMSCs. B, Dendogram depicts relative differences or similarities between the 4 hMSCs samples analyzed in a hierarchical manner. The distance used for the clustering is 1–Pearson correlation between expression values (in log scale) from arrays. The 30d TCM-exposed hMSCs appear to be closer to the 5-aza treated cells in terms of global gene expression than the other control cell types. C, Pie chart of induced KEGG pathways in the MSC treated by TCM for 30 days going clockwise from MAPK signaling pathway. The areas of individual slices represent percentage of genes belonging to the particular pathway that are upregulated following activation by 30d TCM exposure (list of genes in Table-1). D, Gene expression array data from MSC exposed to TCM, 5AZA or control media were analyzed for expression of genes reported to be specifically expressed (i.e., up or down regulated) in carcinoma-associated fibroblasts. A heat-map showing relative expression of these genes amongst the 3 sample conditions is shown (red=higher relative gene expression; blue=lower relative gene expression). The heatmap presents 100 top markers of CAF out of which 53 markers are up regulated in TCM exposed MSCs and 47 markers are down regulated in TCM exposed MSCs (see text for the gene list).
Figure 4
Figure 4
TCM activated hMSCs have increased expression of SDF-1 and promote breast tumor growth in nude mice. A, Expression of SDF-1, a marker of myofibroblasts, is increased in 30d TCM exposed hMSCs. Levels of SDF-1 mRNA were quantitated by quantitative RT-PCR and expressed as fold change over 18sRNA levels. For naïve MSCs the ratio of SDF-1 over 18sRNA is taken as 100 percent. Changes in levels of SDF-1 mRNA/18sRNA following exposure of naïve MSCs to the various conditions are reported as percent changes. B, 30d TCM exposed hMSCs when injected together with MDAMB231 cells result in robust tumor growth in nude mice. In vivo tumor growth was measured over 24 days in nude mice (n=5 for all groups). MDAMB231 cells along with or without TCM exposed hMSCs, naïve hMSCs, 5-aza treated hMSCs or matrigel were injected and palpable tumors were seen on day 10 (tumor cells injected on day 0). The human breast cancer cells MDAMB231 when injected alone did not form tumors in nude mice as shown. Matrigel as well as 30d TCM exposed hMSCs increase growth of MDAMB231 tumors in nude mice as compared to naïve hMSCs and 5-aza treated hMSCs. The naïve hMSCs and the 5-aza treated hMSCs did not show the same robust tumor formation as seen for matrigel and 30d TCM exposed hMSC group. Y-axis represents tumor volume ± S.D. and days following tumor cell injection are shown on the X-axis.
Figure 4
Figure 4
TCM activated hMSCs have increased expression of SDF-1 and promote breast tumor growth in nude mice. A, Expression of SDF-1, a marker of myofibroblasts, is increased in 30d TCM exposed hMSCs. Levels of SDF-1 mRNA were quantitated by quantitative RT-PCR and expressed as fold change over 18sRNA levels. For naïve MSCs the ratio of SDF-1 over 18sRNA is taken as 100 percent. Changes in levels of SDF-1 mRNA/18sRNA following exposure of naïve MSCs to the various conditions are reported as percent changes. B, 30d TCM exposed hMSCs when injected together with MDAMB231 cells result in robust tumor growth in nude mice. In vivo tumor growth was measured over 24 days in nude mice (n=5 for all groups). MDAMB231 cells along with or without TCM exposed hMSCs, naïve hMSCs, 5-aza treated hMSCs or matrigel were injected and palpable tumors were seen on day 10 (tumor cells injected on day 0). The human breast cancer cells MDAMB231 when injected alone did not form tumors in nude mice as shown. Matrigel as well as 30d TCM exposed hMSCs increase growth of MDAMB231 tumors in nude mice as compared to naïve hMSCs and 5-aza treated hMSCs. The naïve hMSCs and the 5-aza treated hMSCs did not show the same robust tumor formation as seen for matrigel and 30d TCM exposed hMSC group. Y-axis represents tumor volume ± S.D. and days following tumor cell injection are shown on the X-axis.
Figure 5
Figure 5
30d TCM exposed hMSCs become incorporated in the tumor stroma to a greater extent than the other co-injected cell types. Immunohistochemical staining for myofibroblast markers α-SMA, FSP and H&E stain in tumor stroma from naïve hMSC+MDAMB231 tumors (small tumor that did not grow in size); MDAMB231 plus matrigel tumors; MDAMB231 plus 5-aza treated hMSCs and tumors from MDAMB231 plus 30d TCM exposed hMSCs respectively.

Similar articles

Cited by

References

    1. Bissell MJ, Radisky D. Putting tumours in context. Nat Rev Cancer. 2001;1:46–54. - PMC - PubMed
    1. Blankenstein T. The role of tumor stroma in the interaction between tumor and immune system. Curr Opin Immunol. 2005;17:180–6. - PubMed
    1. Cardone A, Tolino A, Zarcone R, Borruto Caracciolo G, Tartaglia E. Prognostic value of desmoplastic reaction and lymphocytic infiltration in the management of breast cancer. Panminerva Med. 1997;39:174–7. - PubMed
    1. Orimo A, Gupta PB, Sgroi DC, et al. Stromal fibroblasts present in invasive human breast carcinomas promote tumor growth and angiogenesis through elevated SDF-1/CXCL12 secretion. Cell. 2005;121:335–48. - PubMed
    1. Ishii G, Sangai T, Oda T, et al. Bone-marrow-derived myofibroblasts contribute to the cancer-induced stromal reaction. Biochem Biophys Res Commun. 2003;309:232–40. - PubMed

Publication types