

Review
doi: 10.1196/annals.1413.002.
New horizons for imaging lymphatic function
Affiliations
- PMID: 18519956
- PMCID: PMC3094766
- DOI: 10.1196/annals.1413.002
Item in Clipboard
Review
New horizons for imaging lymphatic function
Ann N Y Acad Sci.
2008.
Abstract
In this review, we provide a comprehensive summary of noninvasive imaging modalities used clinically for the diagnosis of lymphatic diseases, new imaging agents for assessing lymphatic architecture and cancer status of lymph nodes, and emerging near-infrared (NIR) fluorescent optical imaging technologies and agents for functional lymphatic imaging. Given the promise of NIR optical imaging, we provide example results of functional lymphatic imaging in mice, swine, and humans, showing the ability of this technology to quantify lymph velocity and frequencies of propulsion resulting from the contractility of lymphatic structures.
Conflict of interest statement
The authors declare no conflicts of interest.
Figures
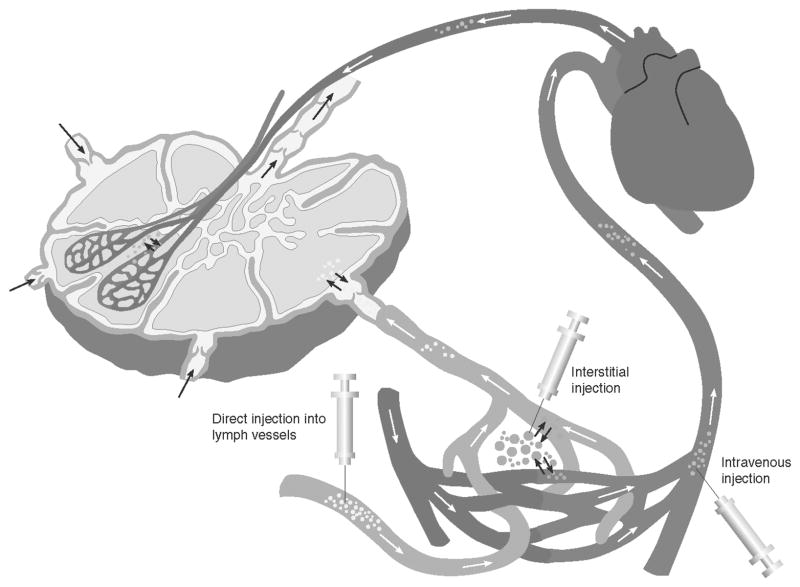
Injection routes to introduce contrast agents into the lymphatics are through interstitial (intradermal or subcutaneous) administration, direct administration into a cannulated lymphatic vessel, or intravenous injection.
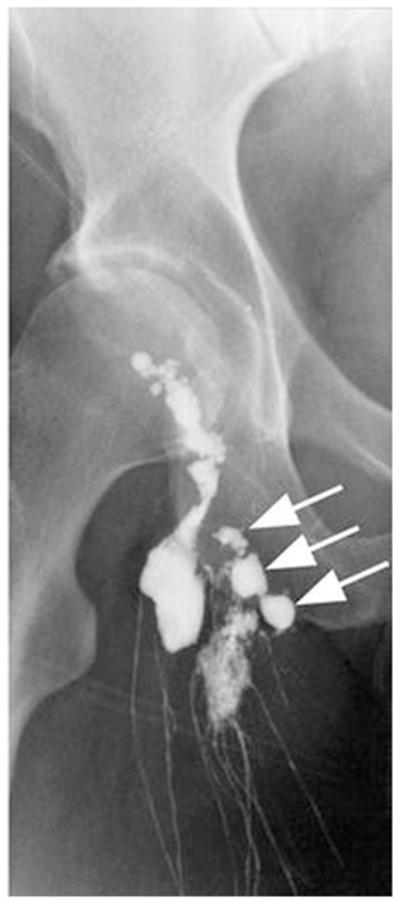
An X-ray radiograph depicts lymphatics and lymphatic fistula in a patient who underwent resection of melanoma of right thigh and inguinal lymphadenectomy. The arrow indicates Lipidiol leakage. Pedal lymphangiography was performed after injection of 14 mL of Lipidiol iodinated glycerol ester. (From Kos et al. Reproduced by permission.)
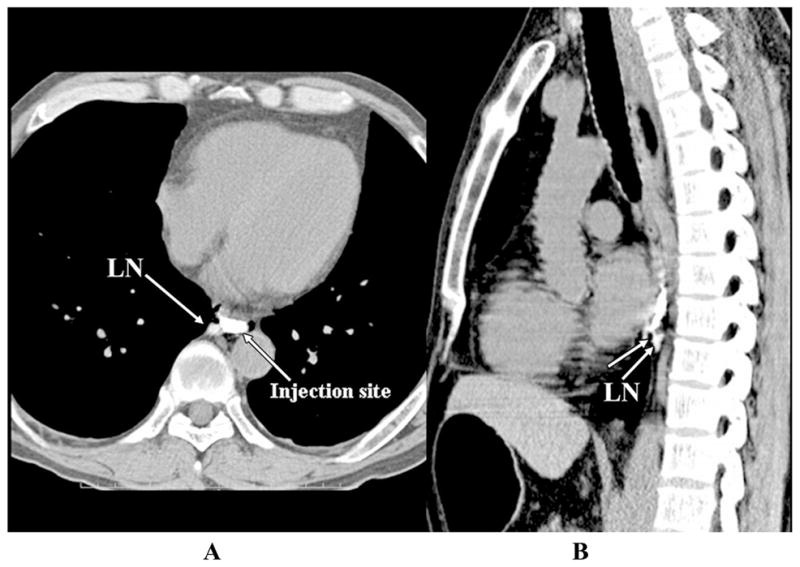
Transverse (A) and sagittal (B) endoscopic contrast-enhanced CT lymphangiograms of a patient with esophageal cancer injected peritumorally with 2 mL of iopamidol. The images identify short lymphatic vessel (unlabeled arrow in B) and a paraesophageal lymph node. (From Suga et al. Reproduced by permission.)
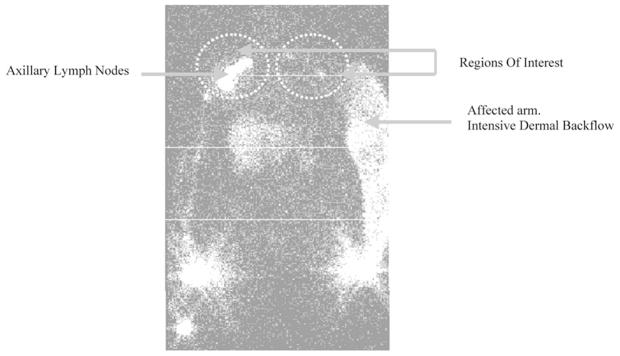
Lymphoscintigram of a postmastectomy lymphedema patient. The affected arm depicts dermal backflow as compared to the unaffected arm that shows a channel draining the injection site to the axillary lymph nodes. (From Szuba et al. Reproduced by permission.)
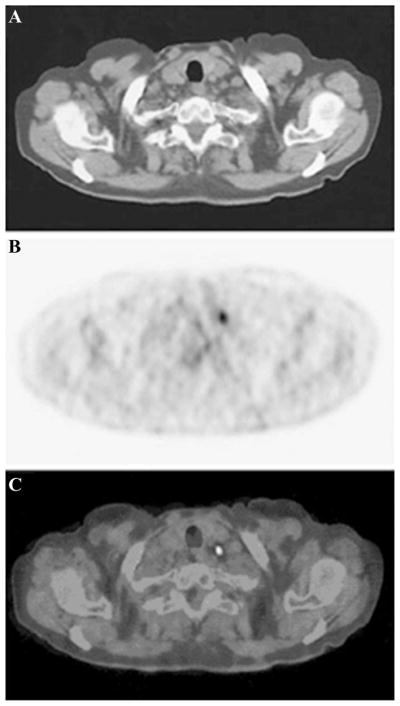
(A) Sagittal CT scan, (B) PET scan, and (C) coregistered PET-CT scan of a patient with non–small cell lung cancer after intravenous injection of 350–400 MBq of 18-FDG. (From Lardinois et al. Reproduced by permission.)
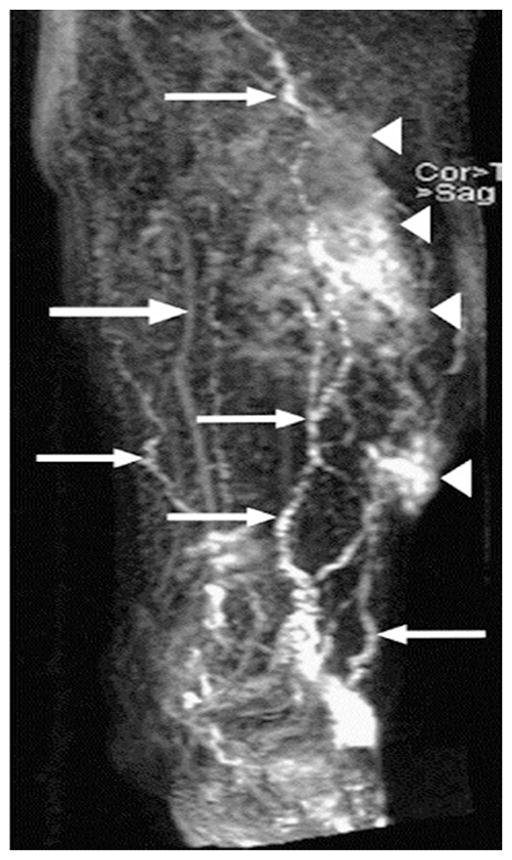
Enlarged lymphatic vessels (small arrows), dermal backflow (arrowheads), and concomitantly enhanced veins (large arrow) in the lower left part of the leg of a 69-year-old man with primary lymphedema. The image was acquired 35 min after gadodiamide injection. (From Lohrmann et al. Reproduced by permission.)
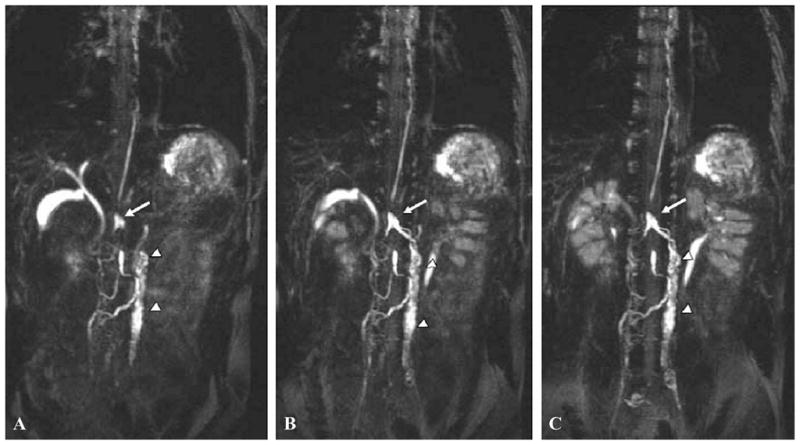
Coronal maximum intensity projection images of a 28-year-old male. Three dimensional heavily T2-weighted images were obtained in the expiratory phase when the diaphragm was at the highest level. (A to C) A high intensity linear structure clearly identifies thoracic duct. Arrows identify a saccular structure to be cysterna chili, and arrowheads indicate lumbar lymphatics and para-aortic lymphatic trunks. The lymphatics were solely identified on the basis of the knowledge of systemic anatomy. (From Matsushima et al. Reproduced by permission.)
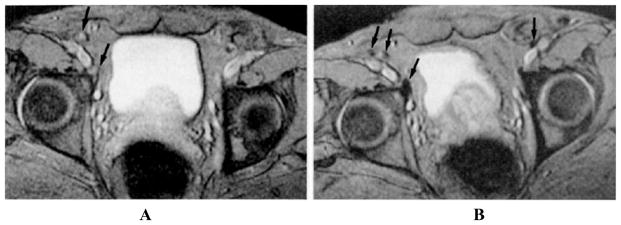
MR images depict benign iliac lymph nodes in a patient with prostatic carcinoma. (A) Precontrast image of external iliac lymph nodes. Arrows indicate iliac lymph nodes that appear bright on account of high signal intensity. (B) Postcontrast image of iliac lymph nodes (arrows) that appear to be dark because of the accumulation of USPIO. Contrast-enhanced MR images are acquired after injection of 1.7 Fe/kg USPIO. (From Bellin et al. Reproduced by permission.)
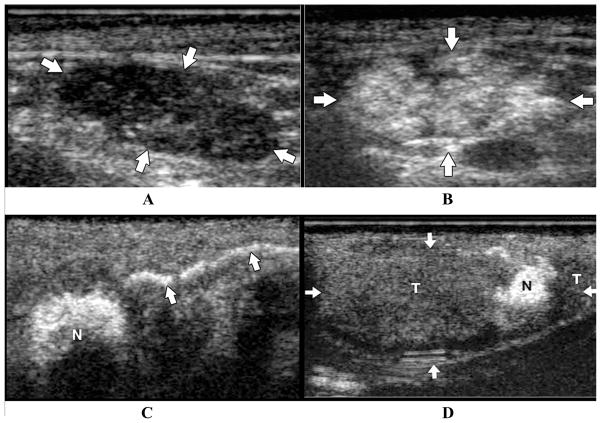
US scans of a normal and malignant lymph nodes pre- and postcontrast subcutaneous administration in a swine model of melanoma. (A) Precontrast US image depict hypoechoic ellipsoid lymph node; (B) postcontrast US scans depict hyperechoic lymph nodes; (C) contrast-enhanced lymph channel draining into a sentinel lymph node (N) subsequent to an intradermal injection of microbubbles; (D) postcontrast US scan of a lymph node (arrows) composed of hypoechoic region depicting buildup of melanoma tumor cells (T), with a small region of normal tissue (N) that demonstrates contrast enhancement. (From Goldberg et al. Reproduced by permission.)
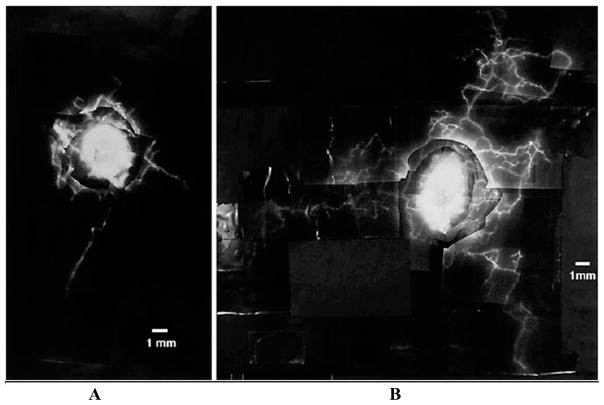
Fluorescence lymphangiogram of a lymphedematous arm depicts denser lymphatic network as opposed to that in normal lymphatics in a postmastectomy lymphedema patient. (A) Lymphatics in affected limb; (B) lymphatics of affected arm of a postmastectomy patient with edema. Ten microliters of 25% (w/v) fluorescein isothiocyanate was injected into the dermis on the ventral aspect of the forearm. (From Mellor et al. Reproduced by permission of S. Karger AG.)
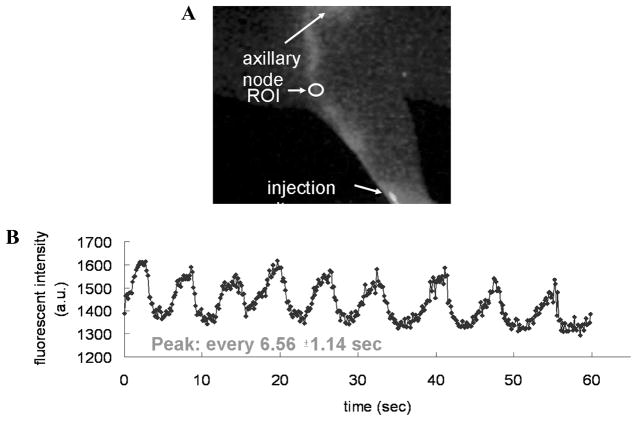
NIR optical imaging enables detection of pulsatile lymph flow in mice. (A) Fluorescence image; (B) intensity profile as a function of time in a specific ROI along a lymph vessel after intradermal injection of 2 μL of 1.29 μM IC-Green in dorsal aspect of paw. The intensity profile shows that the peak fluorescence occurs at an average of every 6.56 ± 1.14 s. (From Kwon and Sevick-Muraca Reproduced by permission.)
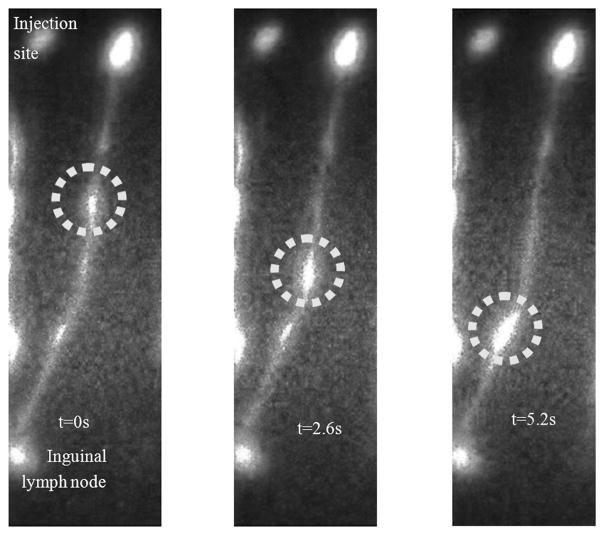
Fluorescent images depict a bolus of IC-Green (circle) transiting along a swine’s abdominal lymph channel at (left) t = 0, (middle) t = 2.6, and (right) t = 5.6 s. The lymphatic channel drained to the swine’s inguinal region.
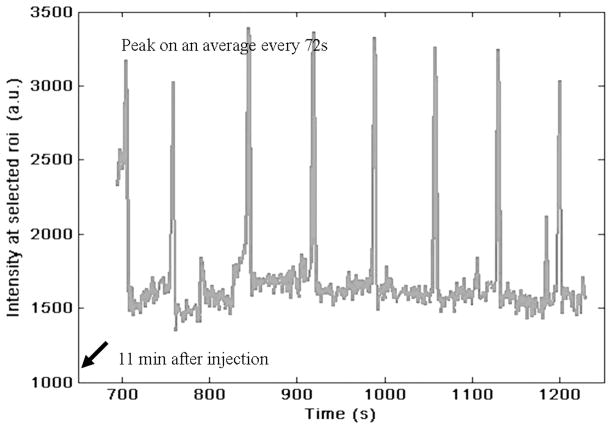
Plot of mean NIR fluorescent intensity profile of a ROI selected on a swine’s abdominal lymphatic vessel as a function of imaging time. Consistent peaks that appear on average every 72 s are observed 11 min after intradermal injection of 200 μL of 32 μM IC-Green and indicate pulsatile lymph flow in swine abdomen.

NIR optical lymph imaging detects pulsatile flow in humans. (A) White-light and NIR fluorescent image overlay of a subject with breast cancer. Intradermal injection is performed with 100 μL of 20 μg IC-Green in the peri-areolar region on the right breast. Arrow identifies a lymph channel on patient’s left breast. (B) Plot of intensity profile at a ROI (oval in A) as a function of duration of image acquisition. The peaks indicate that lymph channel conducts the bolus of IC-Green from the injection site to axilla on an average every 22.9 ± 7.8 s.
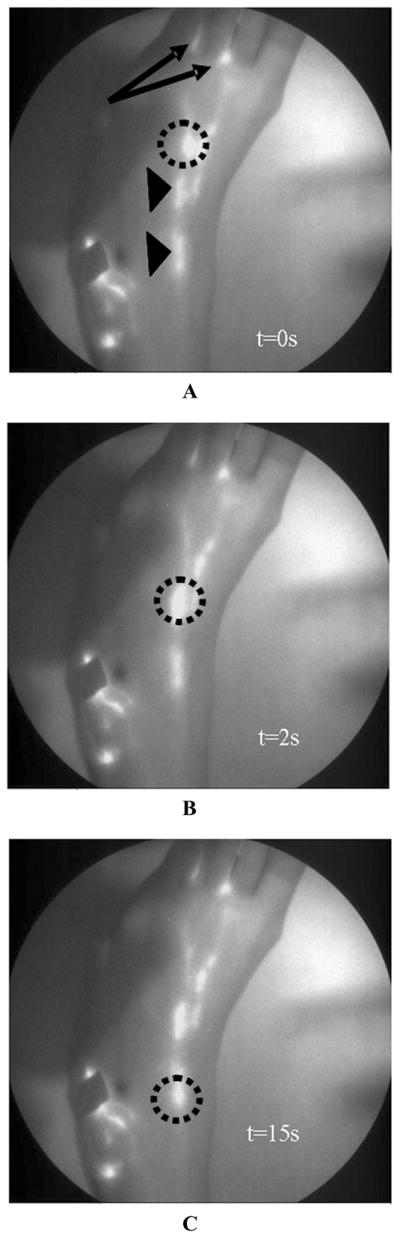
White-light overlay with corresponding fluorescent images of lymphatic map of foot of a 46-year-old female who was injected with 100 μL of 25 μg of IC-Green in the first and second interdigital spaces (arrows) in the dorsum of the foot. Circles indicate a “packet” of dye transiting along the lymphatic channel. Arrowheads identify localized collection of fluorescent dye that could be lymphangions of a lymphatic vessel. Panels A, B and C depict images at 0,2, and 15 s.
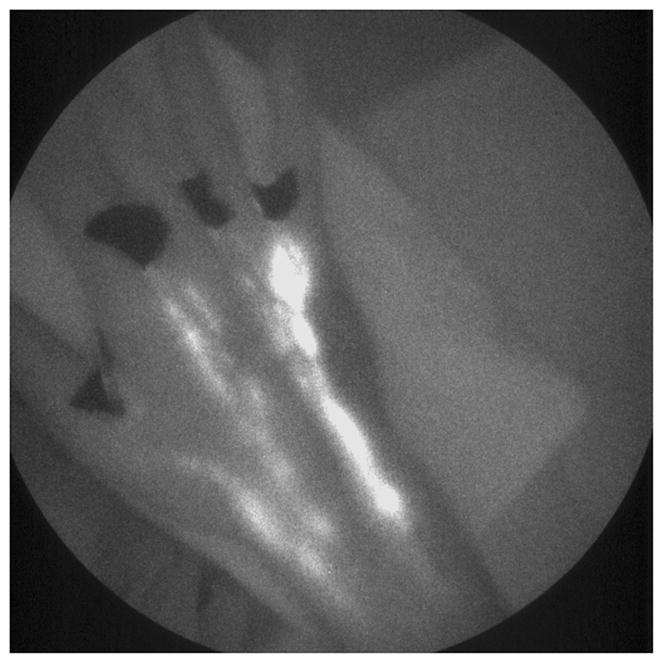
A white-light and fluorescent overlay image of lymphatics in a human hand. A 22-year-old male was injected with 100 μL of 25 μg of IC-Green in the four interdigital spaces on the right hand. Five discrete lymphatics appear to drain the dye from the injection site up to the axilla.
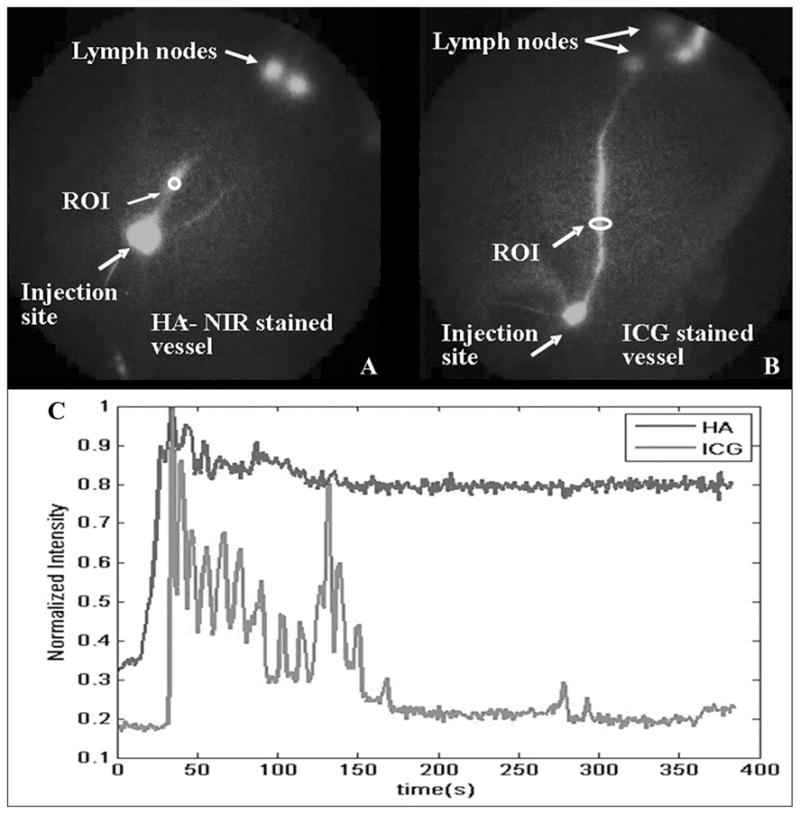
A plot of mean fluorescent intensity of leg lymph vessel stained with HA-NIR and IC-Green at ROIs (ovals) for duration of image acquisition. (A) Oval indicates an ROI selected on leg lymph vessel stained with HA-NIR dye. (B) Oval identifies an ROI on leg lymph vessel with trafficking IC-Green, and (C) comparison of intensity profile as a function of time for selected ROIs. (From Sharma et al. Reproduced by permission.)
Similar articles
-
Quantitative imaging of lymph function.Am J Physiol Heart Circ Physiol. 2007 Jun;292(6):H3109-18. doi: 10.1152/ajpheart.01223.2006. Epub 2007 Feb 16. Am J Physiol Heart Circ Physiol. 2007. PMID: 17307997
-
A Validation Study of Near-Infrared Fluorescence Imaging of Lymphatic Vessels in Humans.Lymphat Res Biol. 2017 Sep;15(3):227-234. doi: 10.1089/lrb.2016.0061. Epub 2017 Jul 27. Lymphat Res Biol. 2017. PMID: 28749720
-
Indocyanine green nanoparticles undergo selective lymphatic uptake, distribution and retention and enable detailed mapping of lymph vessels, nodes and abnormalities.J Drug Target. 2018 Jun-Jul;26(5-6):494-504. doi: 10.1080/1061186X.2018.1433681. Epub 2018 Feb 12. J Drug Target. 2018. PMID: 29388438 Free PMC article.
-
Comprehensive Assessment of Indocyanine Green Usage: One Tracer, Multiple Urological Applications.Eur Urol Focus. 2018 Sep;4(5):665-668. doi: 10.1016/j.euf.2018.08.017. Epub 2018 Sep 7. Eur Urol Focus. 2018. PMID: 30197043 Review.
-
A new lymphography protocol and interpretation principles based on functional lymphatic anatomy in lower limb lymphedema.Anat Sci Int. 2024 Mar;99(2):153-158. doi: 10.1007/s12565-023-00754-2. Epub 2023 Dec 22. Anat Sci Int. 2024. PMID: 38133703 Free PMC article. Review.
Cited by
-
Aging Is Positively Associated with Peri-Sinus Lymphatic Space Volume: Assessment Using 3T Black-Blood MRI.J Clin Med. 2020 Oct 19;9(10):3353. doi: 10.3390/jcm9103353. J Clin Med. 2020. PMID: 33086702 Free PMC article.
-
A multiresolution approach with method-informed statistical analysis for quantifying lymphatic pumping dynamics.Npj Imaging. 2025 Jan 17;3(1):2. doi: 10.1038/s44303-024-00061-z. Npj Imaging. 2025. PMID: 40604254 Free PMC article.
-
Near-infrared photoimmunotherapy of pancreatic cancer using an indocyanine green-labeled anti-tissue factor antibody.World J Gastroenterol. 2018 Dec 28;24(48):5491-5504. doi: 10.3748/wjg.v24.i48.5491. World J Gastroenterol. 2018. PMID: 30622378 Free PMC article.
-
Utility of indocyanine green fluorescence lymphography in identifying the source of persistent groin lymphorrhea.Plast Reconstr Surg Glob Open. 2014 Oct 7;2(9):e210. doi: 10.1097/GOX.0000000000000135. eCollection 2014 Sep. Plast Reconstr Surg Glob Open. 2014. PMID: 25426393 Free PMC article.
-
Pediatric lymphangiectasia: an imaging spectrum.Pediatr Radiol. 2015 Apr;45(4):562-9. doi: 10.1007/s00247-014-3191-x. Epub 2014 Oct 10. Pediatr Radiol. 2015. PMID: 25301383
References
-
- Alitalo K, Tammela T, Petrova TV. Lymphangiogenesis in development and human disease. Nature. 2005;438:946–953. - PubMed
-
- Ji RC. Characteristics of lymphatic endothelial cells in physiological and pathological conditions. Histol Histopathol. 2005;20:155–175. - PubMed
-
- Harvey NL, Srinivasan RS, Dillard ME, et al. Lymphatic vascular defects promoted by Prox1 haploin-sufficiency cause adult-onset obesity. Nat Genet. 2005;37:1072–1081. - PubMed
-
- Cueni LN, Detmar M. New insights into the molecular control of the lymphatic vascular system and its role in disease. J Invest Dermatol. 2006;126:2167–2177. - PubMed
Publication types
MeSH terms
Substances
Grants and funding
LinkOut - more resources
Full Text Sources
Other Literature Sources
Miscellaneous
