Review
. 2008 Jun;86(2):273-326.
doi: 10.1111/j.1468-0009.2008.00522.x.

Population causes and consequences of leading chronic diseases: a comparative analysis of prevailing explanations

Affiliations
Review

Population causes and consequences of leading chronic diseases: a comparative analysis of prevailing explanations

David Stuckler. Milbank Q. 2008 Jun.

Abstract

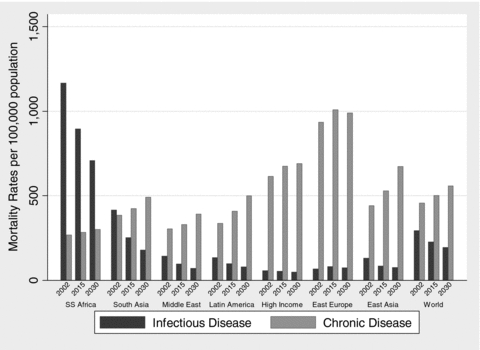
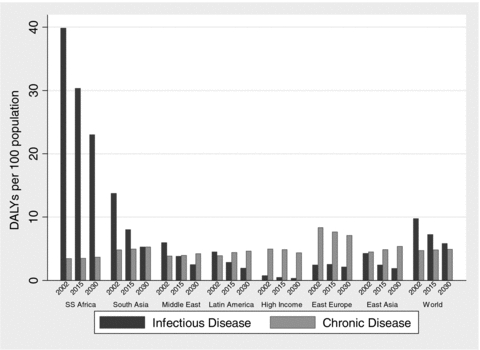
Context: The mortality numbers and rates of chronic disease are rising faster in developing than in developed countries. This article compares prevailing explanations of population chronic disease trends with theoretical and empirical models of population chronic disease epidemiology and assesses some economic consequences of the growth of chronic diseases in developing countries based on the experiences of developed countries.

Methods: Four decades of male mortality rates of cardiovascular and chronic noncommunicable diseases were regressed on changes in and levels of country income per capita, market integration, foreign direct investment, urbanization rates, and population aging in fifty-six countries for which comparative data were available. Neoclassical economic growth models were used to estimate the effect of the mortality rates of chronic noncommunicable diseases on economic growth in high-income OECD countries.

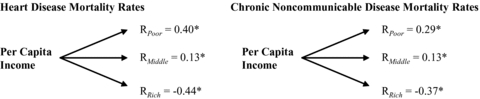
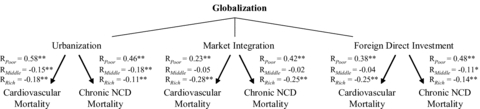
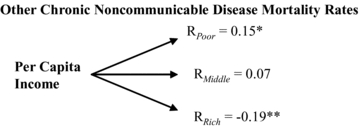
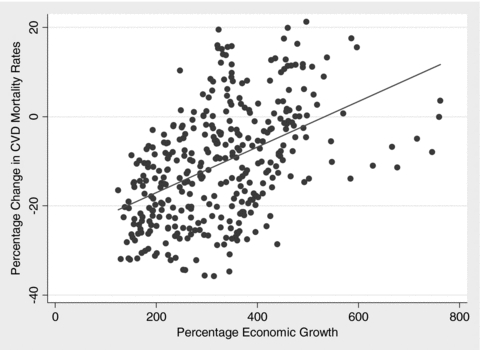
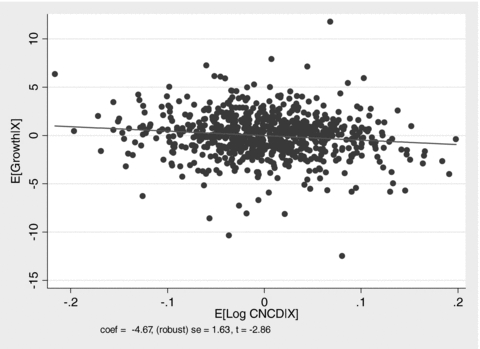
Findings: Processes of economic growth, market integration, foreign direct investment, and urbanization were significant determinants of long-term changes in mortality rates of heart disease and chronic noncommunicable disease, and the observed relationships with these social and economic factors were roughly three times stronger than the relationships with the population's aging. In low-income countries, higher levels of country income per capita, population urbanization, foreign direct investment, and market integration were associated with greater mortality rates of heart disease and chronic noncommunicable disease, less increased or sometimes reduced rates in middle-income countries, and decreased rates in high-income countries. Each 10 percent increase in the working-age mortality rates of chronic noncommunicable disease decreased economic growth rates by close to a half percent.

Conclusions: Macrosocial and macroeconomic forces are major determinants of population rises in chronic disease mortality, and some prevailing demographic explanations, such as population aging, are incomplete on methodological, empirical, and policy grounds. Rising chronic disease mortality rates will significantly reduce economic growth in developing countries and further widen the health and economic gap between the developed and developing world.


Figures

Figure 1
Figure 1
Evolution of the Global Burden of Disease, 2002 to 2030 Notes: Infectious disease classification is based on WHO's type 1 burden of disease cluster. Chronic disease classification is based on cardiovascular disease, cancers, respiratory disease, and diabetes mellitus subcategories of WHO's type 2 burden of disease cluster. Appendix 1 further describes the data sources, disease classifications, and calculations. Source: Author's calculations based on Mathers and Loncar 2006 and WHO's Global Burden of Disease projections.
Figure 2
Figure 2
Transition-State Model of Chronic Disease Epidemiology Notes: P is a population probability, and for each state (healthy, behavioral risk, clinical risk, morbidity, and mortality) refers to the probability that an individual transitions from one chronic disease state to the next. For example, P1 refers to an individual's transition from being healthy to acquiring a behavioral risk, such as initiating tobacco or being sedentary. Sitting above P1 in the model is the effectiveness of primary prevention and a set of social determinants, which are shown to modify this population transition probability both positively and negatively. The model is based upon a Markov process modeling framework, which is increasingly being used to model comparatively the effectiveness of population interventions at various stages of the transitions from health to chronic disease mortality.
Figure 3
Figure 3
Associations between Country-Income Levels per Capita and Log Heart Disease and Chronic Noncommunicable Disease Mortality Rates Notes: Poor countries < US$3,000 per capita income, middle countries > $3,000 and < $7,000, and rich countries > $7,000 on average from 1960 to 2002. Male mortality rate data are from the WHO Global Mortality Database and are in logs. Chronic noncommunicable disease is WHO's type 2 burden of disease category. Economic data are from the World Bank's World Development Indicators, 2005 ed., and the International Monetary Fund's International Financial Statistics, 2007 series. Per capita income is based on gross domestic product (GDP) per capita. Cross-country data are de-trended for effects of changing ICD classifications. Appendix 2 describes all data and presents descriptive statistics. Significance at *p < 0.01.
Figure 4
Figure 4
Associations between Globalization and Log Heart Disease and Chronic Noncommunicable Disease Mortality Rates Notes: Poor countries < US$3,000 per capita income, middle countries >$3,000 and <$7,000, and rich countries >$7,000 on average from 1960 to 2002. Male mortality rate data are from the WHO Global Mortality Database and are in logs. Chronic NCD is chronic noncommunicable disease mortality based on WHO's type-2 burden of disease category. Economic data are from the World Bank's World Development Indicators, 2005 ed., and the International Monetary Fund International Financial Statistics 2007 series. Urbanization is the percentage of population living in urban settings. Market integration is total capital flows as a percentage of GDP. Foreign direct investment is the log level of foreign direct investment inflows. Cross-country data are de-trended for effects of changing ICD classifications. Appendix 2 describes all data and presents descriptive statistics. *p < 0.05, **p < 0.01.
Figure A1
Figure A1
Evolution of the Global Burden of Disease, 2002 to 2030 Notes: DALYs are disability-adjusted life years. Infectious disease classification is based on WHO's type 1 burden of disease cluster. Chronic disease classification is based on cardiovascular disease, cancers, respiratory disease, and diabetes mellitus subcategories of WHO's type 2 burden of disease cluster. Source: Author's calculations based on Mathers and Loncar 2006 and WHO's Global Burden of Disease projections.
Figure A2
Figure A2
Replication Using Other Chronic Noncommunicable Disease Mortality Rates Notes: Poor countries < US$3,000 per capita income, middle countries > $3,000 and < $7,000, and rich countries > $7,000 on average from 1960 to 2002. Male mortality rate data are from the WHO Global Mortality Database and are in logs. Other chronic noncommunicable disease is WHO's type 2 burden of disease category excluding cardiovascular disease. Economic data are from the World Bank's World Development Indicators, 2005 ed., and the International Monetary Fund's International Financial Statistics, 2007 series. Per capita income is based on gross domestic product (GDP) per capita. Cross-country data are de-trended for effects of changing ICD classifications. Appendix 2 describes all data and presents descriptive statistics. Significance at *p < 0.05, **p < 0.01.
Figure A3
Figure A3
Sample Unadjusted Relationship between Economic Growth and Cardiovascular Disease Mortality Rates, High-Income Countries, Twenty-Year Differences, 1960 to 2002
Figure A4
Figure A4
Added-Variable Plot

References

    1. Aboderin I, Kalache A, Ben-Shlomo Y, Lynch JW, Yajnik CS, Kuh D, Yach D. Life-Course Perspectives on Coronary Heart Disease, Stroke and Diabetes: Key Issues and Implications for Policy and Research. 2001. [accessed March 31, 2008]. Geneva: World Health Organization. Available at http://whqlibdoc.who.int/hq/2001/WHO_NMH_NPH_01.4.pdf.
    1. Bashar M, Alcabes P, Rom WN, Condos R. Increased Incidence of Multi-Drug Resistant Tuberculosis in Diabetic Patients on the Bellevue Chest Service, 1987 to 1997. Chest. 2001;120:1514–19. - PubMed
    1. Bates MN, Khalakdina A, Pai M, Change L, Lessa F, Smith KR. Risk of Tuberculosis from Exposure to Tobacco Smoke: A Systematic Review and Meta-Analysis. Archives of Internal Medicine. 2007;167(4):335. - PubMed
    1. Beaglehole R, Yach D. Globalisation and the Prevention and Control of Non-Communicable Disease: The Neglected Chronic Diseases of Adults. The Lancet. 2003;362(9387):903–8. - PubMed
    1. Beck N, Katz JN. What to Do (and Not to Do) with Time-Series Cross-Section Data. American Political Science Review. 1995;89:634–47.

MeSH terms