. 2008 Jun;7(6):485-95.
doi: 10.1016/j.cmet.2008.04.002.

Adipocyte-derived Th2 cytokines and myeloid PPARdelta regulate macrophage polarization and insulin sensitivity

Affiliations

Adipocyte-derived Th2 cytokines and myeloid PPARdelta regulate macrophage polarization and insulin sensitivity

Kihwa Kang et al. Cell Metab. 2008 Jun.

Abstract

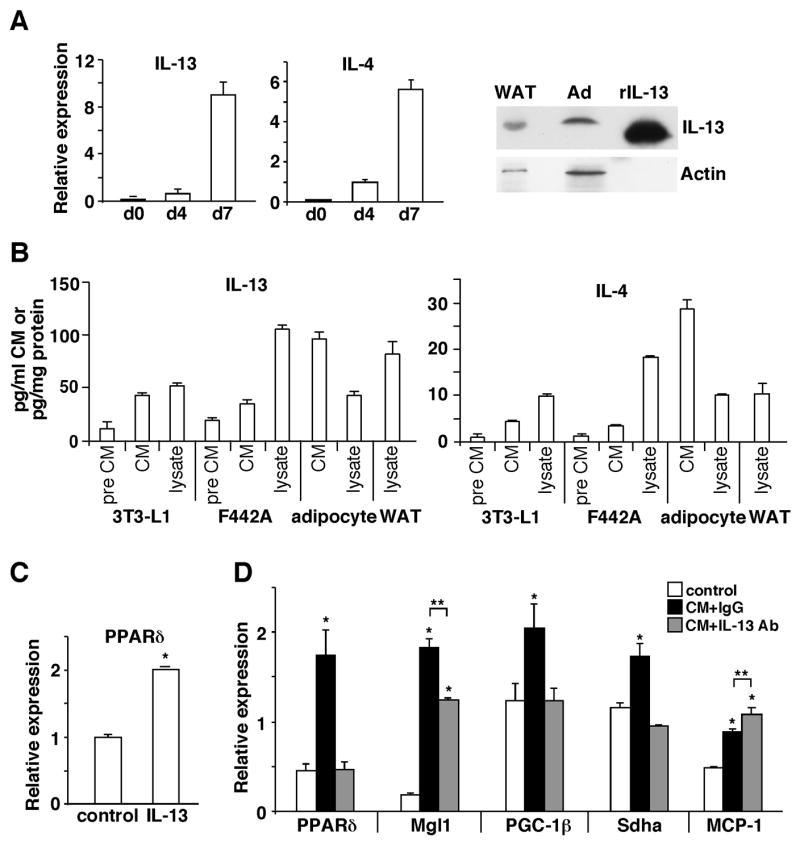
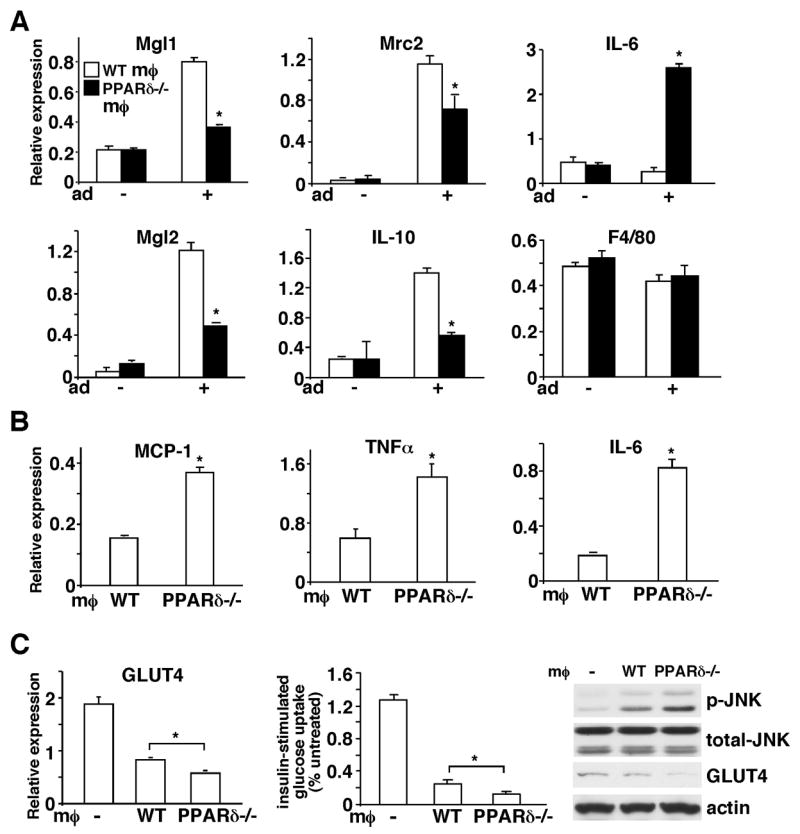
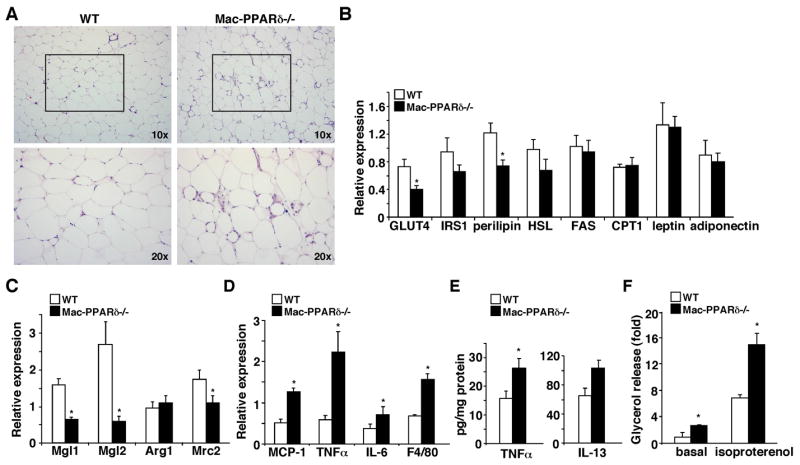
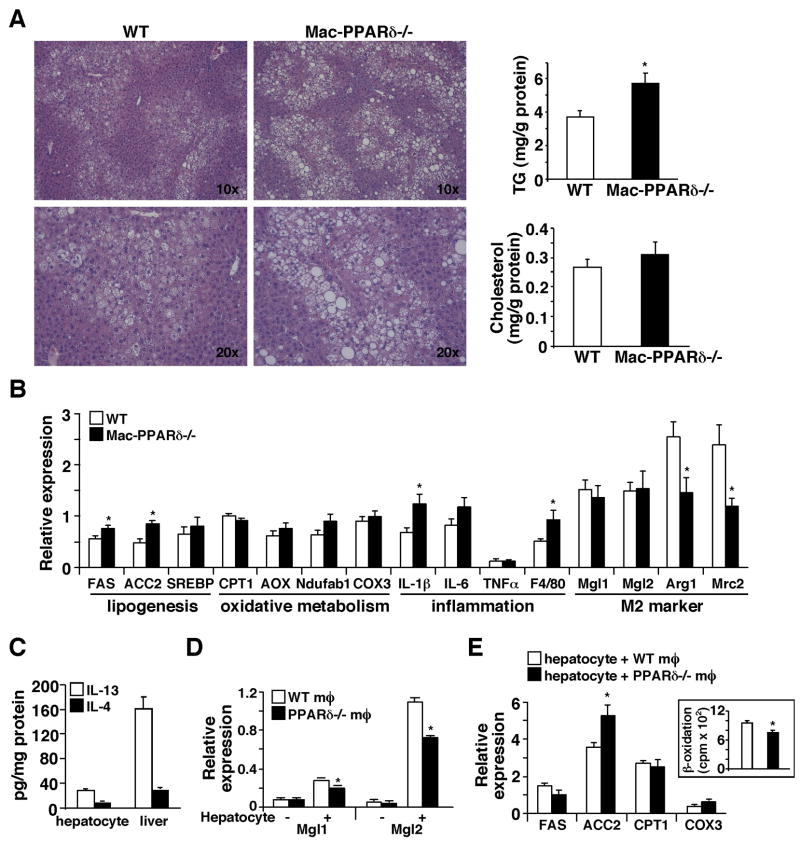
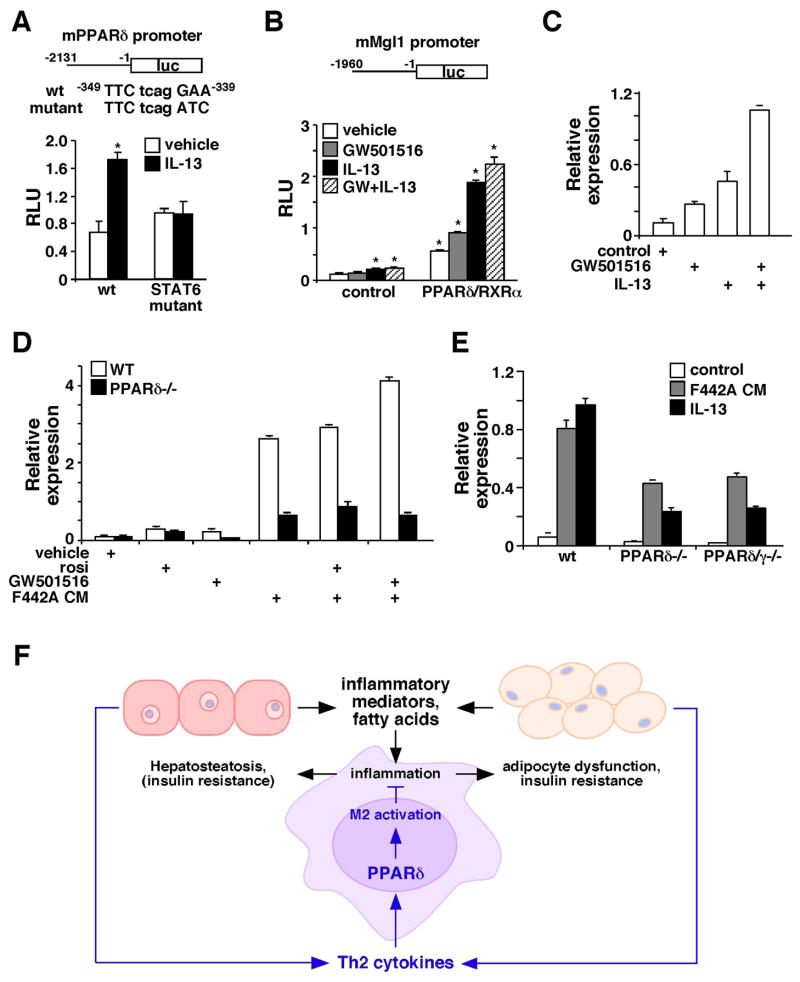
The polarization of adipose tissue-resident macrophages toward the alternatively activated, anti-inflammatory M2 phenotype is believed to improve insulin sensitivity. However, the mechanisms controlling tissue macrophage activation remain unclear. Here we show that adipocytes are a source of Th2 cytokines, including IL-13 and to a lesser extent IL-4, which induce macrophage PPARdelta/beta (Ppard/b) expression through a STAT6 binding site on its promoter to activate alternative activation. Coculture studies indicate that Ppard ablation renders macrophages incapable of transition to the M2 phenotype, which in turns causes inflammation and metabolic derangement in adipocytes. Remarkably, a similar regulatory mechanism by hepatocyte-derived Th2 cytokines and macrophage PPARdelta is found to control hepatic lipid metabolism. The physiological relevance of this paracrine pathway is demonstrated in myeloid-specific PPARdelta(-/-) mice, which develop insulin resistance and show increased adipocyte lipolysis and severe hepatosteatosis. These findings provide a molecular basis to modulate tissue-resident macrophage activation and insulin sensitivity.


Figures

Figure 1
Figure 1. PPARδ mediates the effect of adipocyte conditioned medium on induction of M2 macrophage markers
(A) M2 markers, Mgl1 and Mgl2, are induced in macrophages treated with conditioned medium (CM) collected from 3T3-L1 or 3T3 F442A adipocytes. The expression of MCP-1 and TNFα also increased 24 hours after CM treatment but declined at 48 hours. Gene expression was determined by real-time RT-PCR. (B) Adipocyte CM increases STAT6 activity in the macrophage. Protein lysates from WT or PPARδ−/− macrophage were subjected to Western blot analyses. The phospho-STAT6 (p-STAT6) and phospho-JNK (p-JNK) signal was used to determine their respective activities. Total STAT6 and JNK (t-STAT6 and t-JNK) were included as loading controls. The − and + sign indicate without or with CM treatment (48 hours), respectively. (C) The ability of 3T3-L1 adipocyte CM to activate M2 genes is reduced in PPARδ−/− macrophages. IL-4R: IL-4 receptor; IL-13Rα1: IL-13 receptor α1. Values are expressed as means ± SEM. *p<0.05, comparing − and + treatment within the same genotype.
Figure 2
Figure 2. Adipocytes produce Th2 cytokines
(A) The expression of IL-13 and IL-4 is induced during 3T3-L1 adipocyte differentiation. Gene expression was determined by real-time PCR at day 0, 4 and 7 (d0, d4 and d7) of the differentiation process. IL-13 protein in 3T3-L1 adipocyte (Ad) and WAT lysate (100 μg) was detected by Western blotting. Recombinant IL-13 (rIL-13, 60 ng) was included as a control. (B) Quantification of Th2 cytokines in CM and lysate from 3T3-L1, 3T3 F442A and primary adipocytes and WAT by ELISA. Pre CM: pre-adipocyte CM. (C) IL-13 induces PPARδ expression in the macrophage determined by real-time PCR. Cells were given IL-13 (20 ng/ml) for 24 hours. (D) IL-13 neutralizing antibody pre-incubation abolishes the ability of CM to induce alternative activation. 3T3-l1 adipocyte CM was pre-incubated with an IL-13 neutralizing antibody (Ab) or control IgG one hour prior to treating macrophages. Values are expressed as means ± SEM. *p<0.05, comparing CM treatment to control; **p<0.05, comparing IgG to IL-13 Ab.
Figure 3
Figure 3. Assessment of the role of alternative activation regulated by macrophage PPARδ in WAT homeostasis using a co-culture model
(A) PPARδ plays an important role in macrophage alternative activation induced by adipocyte-derived Th2 cytokines. A co-culture system was established to mimic the WAT microenvironment, in which macrophages were cultured in an insert on a semi-permeable membrane and differentiated 3T3-L1 adipocytes were grown in the lower chamber of the well. Gene expression in macrophages was determined 48 hours after co-culturing with adipocytes by real-time PCR. Mgl1, Mgl2, Mrc2 and IL-10 are M2 markers and F4/80 is a macrophage marker included as a control. The − and + signs indicate without or with adipocytes (Ad) co-culture. (B) Adipocytes co-cultured with PPARδ−/− macrophages express higher levels of pro-inflammatory mediators. Two days after co-culturing with macrophages, adipocytes were harvested and gene expression was determined by real-time PCR. (C) Adipocytes co-cultured with PPARδ−/− macrophages have reduced GLUT4 expression and insulin stimulated glucose uptake. The expression of GLUT4 in control adipocytes (indicated with −) or adipocytes co-cultured with WT or PPARδ−/−macrophages was determined by real-time PCR and Western blotting. The glucose uptake assay was performed using radioactive 2-deoxy-glucose. p-JNK: phospho-JNK; t-JNK: total JNK; MØ: macrophage. Values are expressed as means ± SEM. *p<0.05, comparing WT to PPARδ−/− macrophages.
Figure 4
Figure 4. Mac-PPARδ−/− mice develop WAT insulin resistance
(A) Hyperinsulinemia and insulin resistance in Mac-PPAR−/− mice on a high fat diet. The GTT (left), insulin production during the GTT (middle) and ITT were conducted on male mice (n=7) after 4 months on a high fat diet. (B) and (C) Defective insulin signaling in WATs of Mac-PPARδ−/− mice. Mice were given 5u insulin/kg body weight through the portal vein. Tissues were collected right before or 5 min after injection. Insulin stimulated Akt phosphorylation (p-Akt) (B) and IRβ tyrosine phosphorylation (C) was determined in WAT lysates from 5 individual wt or Mac-PPARδ−/− mice by Western blot analyses. IRβ was immunoprecipitated, followed by immunoblotting with anti-phospho-tyrosine (p-Tyr-IRβ) and anti-IRβ antibodies. The level of insulin-stimulated phosphorylation was quantified and normalized to that of total protein to obtain fold changes. Similar results were obtained using actin for normalization. t-Akt: total Akt. (D) Western blot analyses demonstrating increased JNK and decreased STAT6 signaling in WATs of Mac-PPARδ−/− mice. p-JNK and p-STAT6: phospho-JNK and STAT6; t-JNK and t-STAT6: total JNK and STAT6. Values are expressed as means ± SEM. *p<0.05, comparing WT to Mac-PPARδ−/− mice.
Figure 5
Figure 5. Increased WAT inflammation and adipocyte lipolysis in Mac-PPARδ−/− mice
(A) Histological analyses of WAT sections (H & E staining) from high fat fed WT and Mac-PPARδ−/− mice. Mac-PPARδ−/− WATs contained small adipocytes that were surrounded by macrophages. (B) Analyses of metabolic gene expression in WAT by real-time PCR. IRS1: insulin receptor substrate 1; HSL: hormone sensitive lipase; FAS: fatty acid synthase; CPT1: carnitine palmitoyltransferase 1. (C) M2 markers are down-regulated in WATs of Mac-PPARδ−/− mice. M2 gene expression was determined by real-time PCR and normalized with F4/80. (D) WATs of Mac-PPARδ−/− mice exhibit elevated inflammatory gene expression. Gene expression was determined by real-time PCR. (E) Determination of TNFα and IL-13 protein concentration in WAT by ELISA (F) Increased lipolysis in primary adipocytes from Mac-PPARδ−/− mice. The rate of lipolysis was determined by glycerol release at the baseline or upon isoproterenol stimulation. Values are expressed as means ± SEM. *p<0.05, comparing WT to Mac-PPARδ−/− mice.
Figure 6
Figure 6. Mac-PPARδ−/− mice exhibit severe hepatic steatosis
(A) Histological analyses of liver sections (H & E staining) from high fat fed WT and Mac-PPARδ−/−mice. Livers of Mac-PPARδ−/− mice contained larger lipid droplets. Hepatic lipid content was determined by enzymatic assays and normalized to protein content. (B) Analyses of metabolic and inflammatory gene expression in the liver by real-time PCR. ACC2: acetyl-CoA carboxylase 2; SREBP: sterol regulatory element-binding protein 1-c; Aox: acetyl-CoA oxidase. (C) Hepatocyes are a source of Th2 cytokines. IL-13 and IL-4 concentrations in lysates of isolated hepatocytes and liver were determined by ELISA. (D) M2 markers are induced in macrophages co-cultured with primary hepatocytes. Experiments were conducted similar to those in macrophage-adipocyte co-culture. The induction of Mgl1/2 was diminished in PPARδ−/− macrophages. The − and + signs indicate without or with hepatocyte co-culture. (E) Hepatocytes co-cultured with PPARδ−/− macrophages have increased ACC2 expression and reduced fatty acid oxidation. Insert: the rate of fatty acid β-oxidation determined by 3H2O production fromp 3H-fatty acids. Values are expressed as means ± SEM. *p<0.05.
Figure 7
Figure 7. Synergistic regulation of M2 gene expression by IL-13 and PPARδ
(A) PPARδ promoter activity is induced by IL-13 through a STAT6 binding site. A luciferase (luc) reporter driven by mouse PPARδ promoter (upper panel) was transfected into RAW264.7 cells. IL-13 was given at 40 ng/ml. The transcriptional initiation site was designated as +1 and the putative STAT6 binding site was indicated. STAT6 mutant: PPARδ promoter reporter with the mutated STAT6 binding site; RLU: relative luciferase unit. Values are expressed as means ± SEM. *p<0.05. (B) Mgl1 promoter is regulated by PPARδ and IL-13. Mgl1 promoter reporter was transfected into RAW264.7 cells, together with either the control vector or expression vectors for PPARδ and RXRα. Cells were treated with IL-13 (40 ng/ml) and/or a PPARδ agonist, GW501516 (0.1 μM). *p<0.05, comparing to vehicle treated control. (C) Co-treatment with IL-13 and GW501516 synergistically induces Mgl1 expression in the macrophage. Mgl1 expression was determined 48 hours after treatments by real-time PCR. (D) PPARγ activation could not compensate for PPARδ function in alternative activation. Mgl1 expression was measured in WT and PPARδ−/− macrophages treated with rosiglitazone (rosi, PPARγ agonist, 1μM), GW501516, 3T3 F442A adipocyte CM or the combinations. (E) PPARδ/γ−/− and PPARδ−/− macrophages show a similar reduction in F442A adipocyte CM and IL-13 stimulated Mgl1 expression. (F) Model for the role of macrophage PPARδ in metabolic homeostasis. Macrophages in WAT and the liver are prone to activation by stimulants, such as Th1 cytokines and free fatty acids. As a regulatory mechanism, adipocytes and hepatocytes produce Th2 cytokines to dampen inflammation. The signaling of Th2 cytokines is amplified through the activation of STAT6 and induction of PPARδ. Fatty acids also serve as ligands to activate PPARδ to control the expression of M2 genes as well as genes encoding oxidative metabolism, including PGC-1δ, which is required for STAT6 co-activation. High fat feeding or PPARδ gene deletion disrupts this homeostasis, leading to metabolic dysfunction in WAT and the liver.

Comment in

References

    1. Abu-Elheiga L, Matzuk MM, Abo-Hashema KA, Wakil SJ. Continuous fatty acid oxidation and reduced fat storage in mice lacking acetyl-CoA carboxylase 2. Science. 2001;291:2613–2616. - PubMed
    1. Barak Y, Liao D, He W, Ong ES, Nelson MC, Olefsky JM, Boland R, Evans RM. Effects of peroxisome proliferator-activated receptor delta on placentation, adiposity, and colorectal cancer. Proc Natl Acad Sci U S A. 2002;99:303–308. - PMC - PubMed
    1. Barak Y, Nelson MC, Ong ES, Jones YZ, Ruiz-Lozano P, Chien KR, Koder A, Evans RM. PPAR gamma is required for placental, cardiac, and adipose tissue development. Mol Cell. 1999;4:585–595. - PubMed
    1. Barish GD, Atkins AR, Downes M, Olson P, Chong LW, Nelson M, Zou Y, Hwang H, Kang H, Curtiss L, et al. PPAR{delta} regulates multiple proinflammatory pathways to suppress atherosclerosis. Proc Natl Acad Sci U S A. 2008;105:4271–4276. - PMC - PubMed
    1. Bouhlel MA, Derudas B, Rigamonti E, Dievart R, Brozek J, Haulon S, Zawadzki C, Jude B, Torpier G, Marx N, et al. PPARgamma activation primes human monocytes into alternative M2 macrophages with anti-inflammatory properties. Cell Metab. 2007;6:137–143. - PubMed

Publication types

MeSH terms