. 2008 Jun;7(6):520-32.
doi: 10.1016/j.cmet.2008.04.011.

Dephosphorylation of translation initiation factor 2alpha enhances glucose tolerance and attenuates hepatosteatosis in mice

Affiliations

Dephosphorylation of translation initiation factor 2alpha enhances glucose tolerance and attenuates hepatosteatosis in mice

Seiichi Oyadomari et al. Cell Metab. 2008 Jun.

Abstract

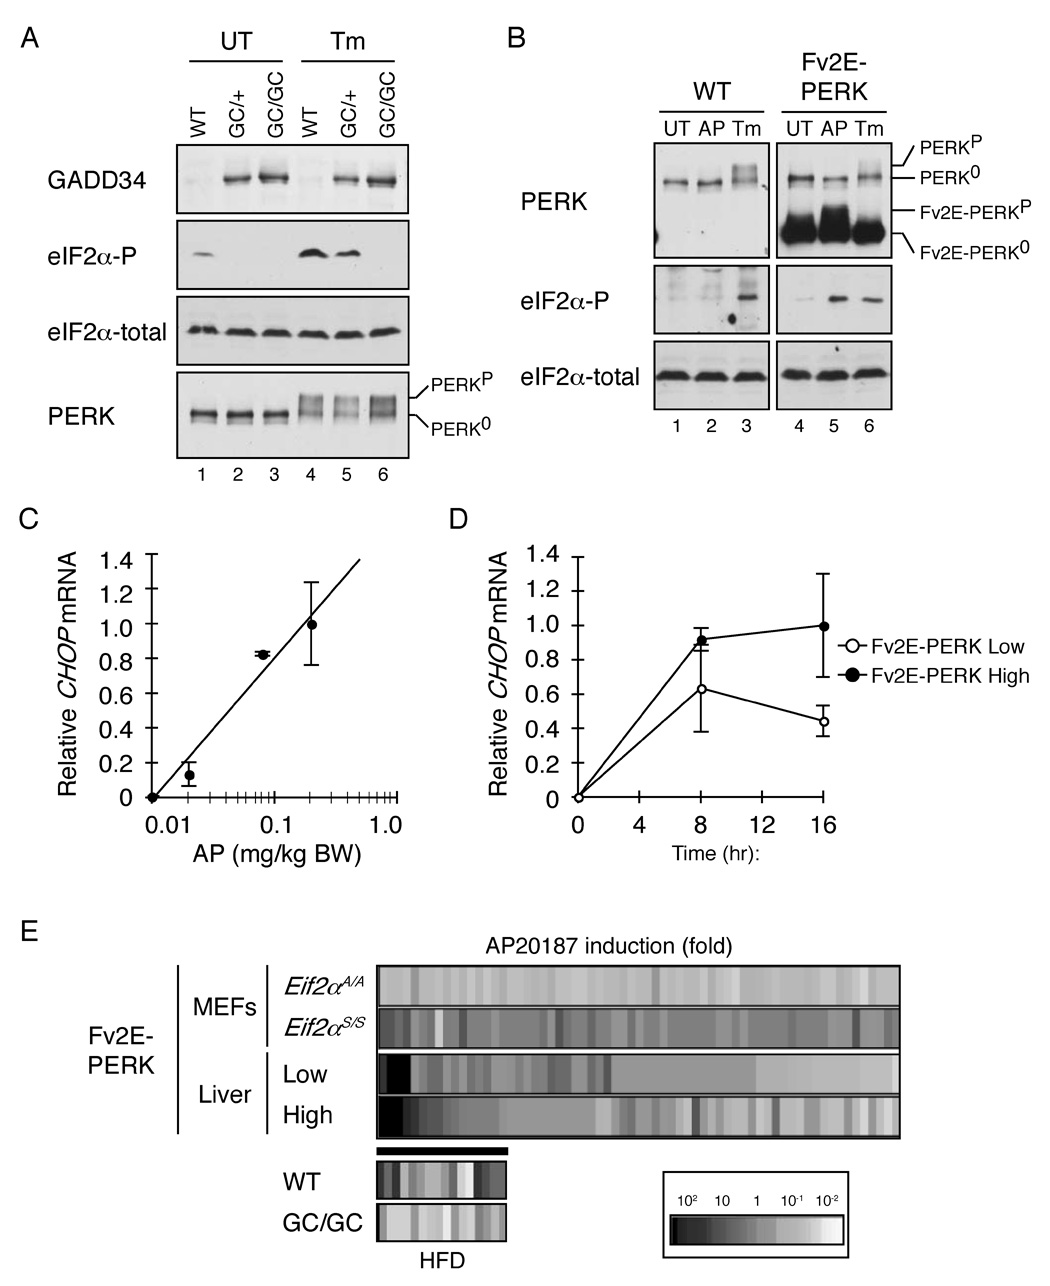
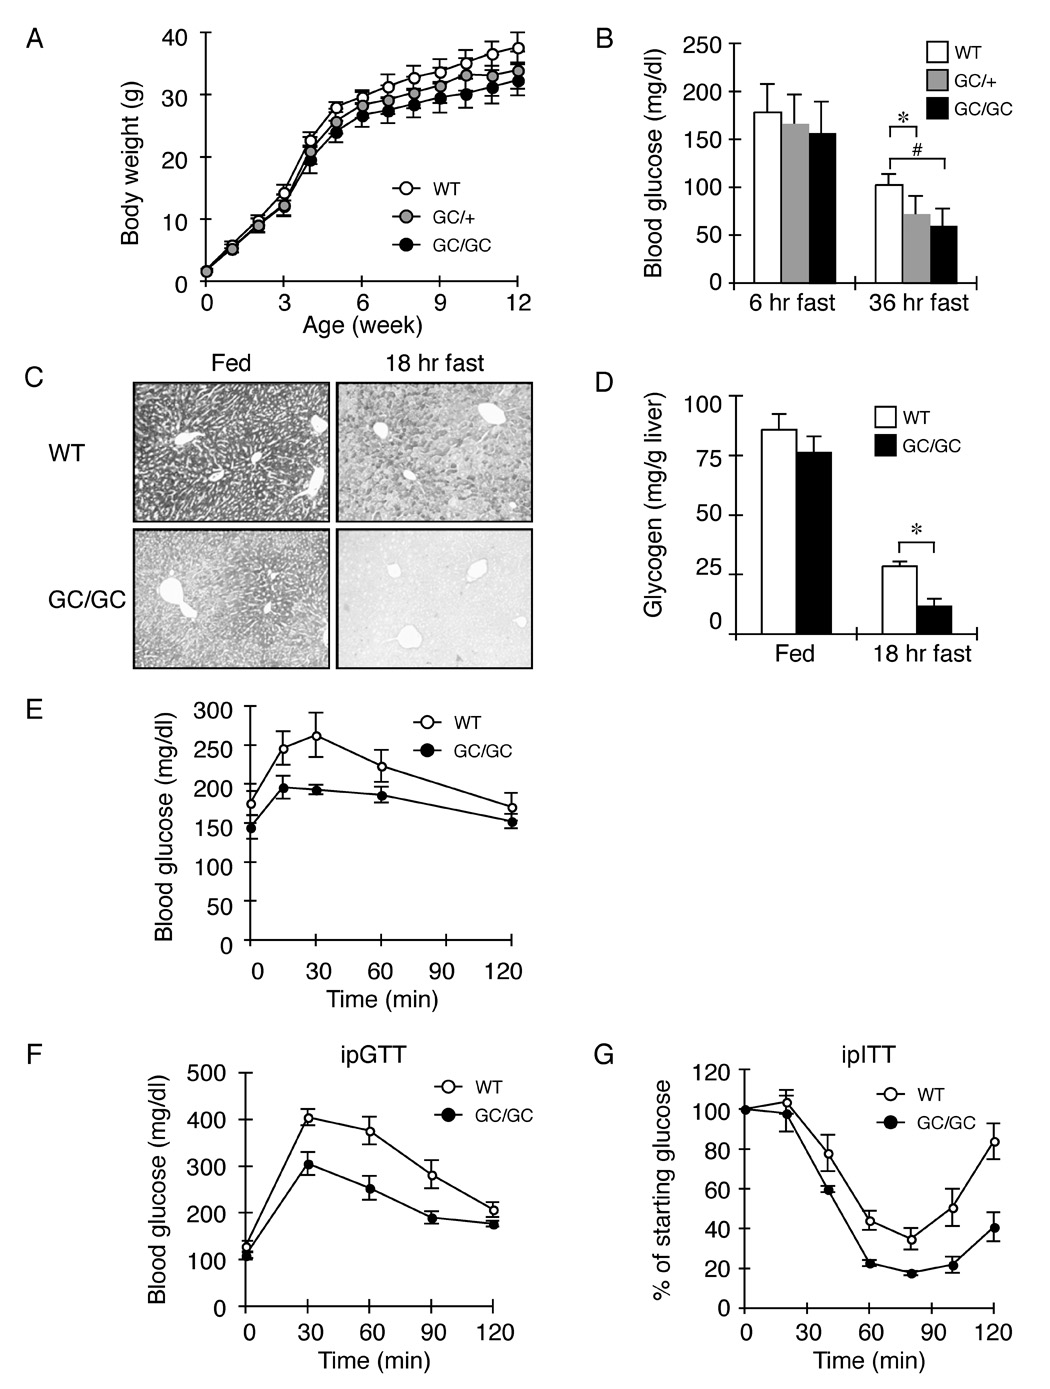
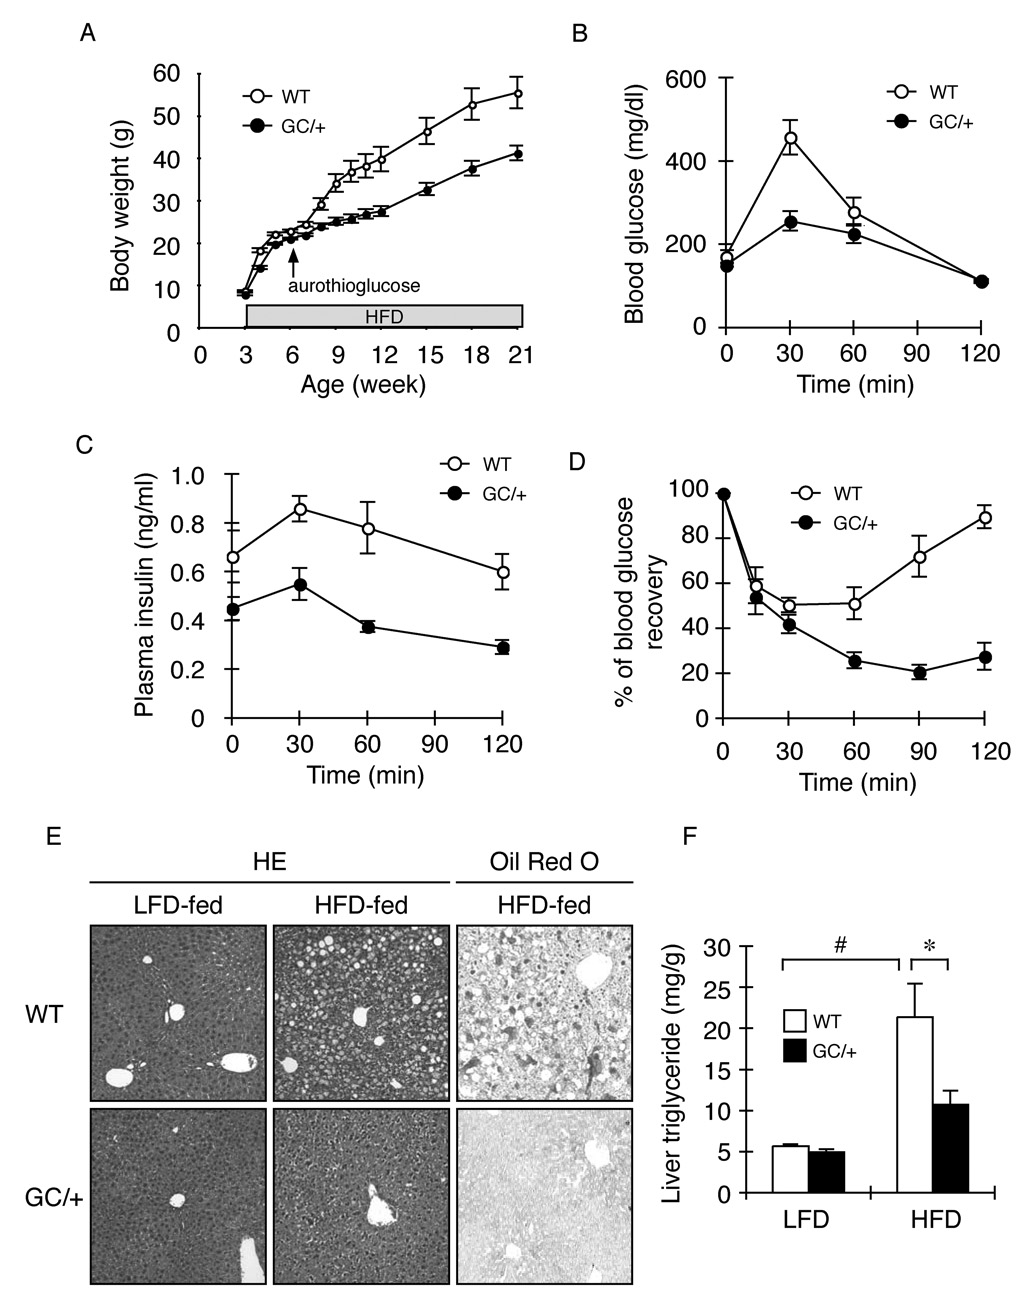
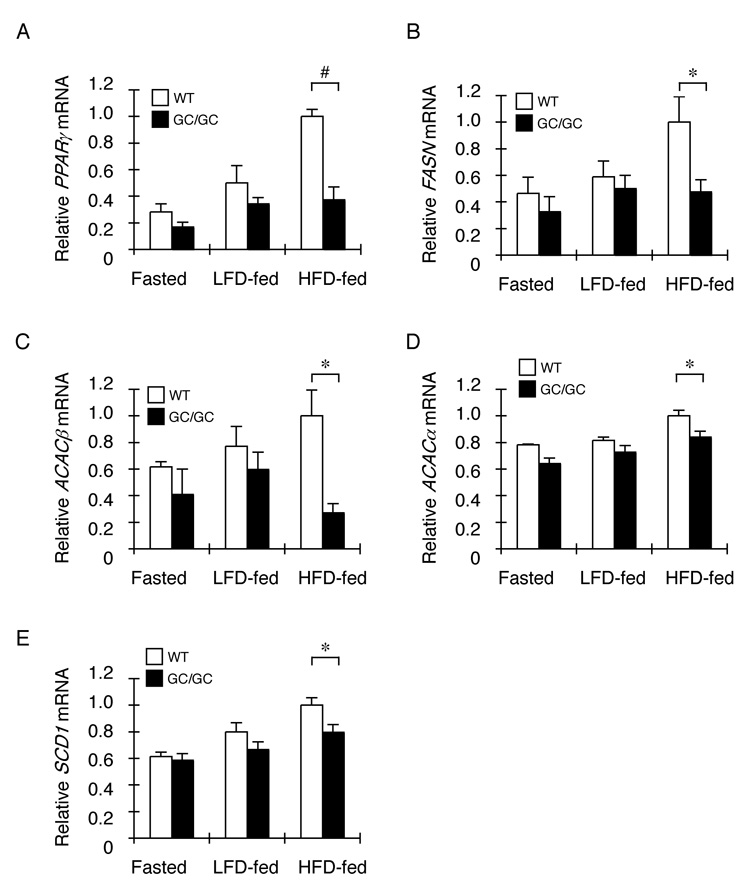
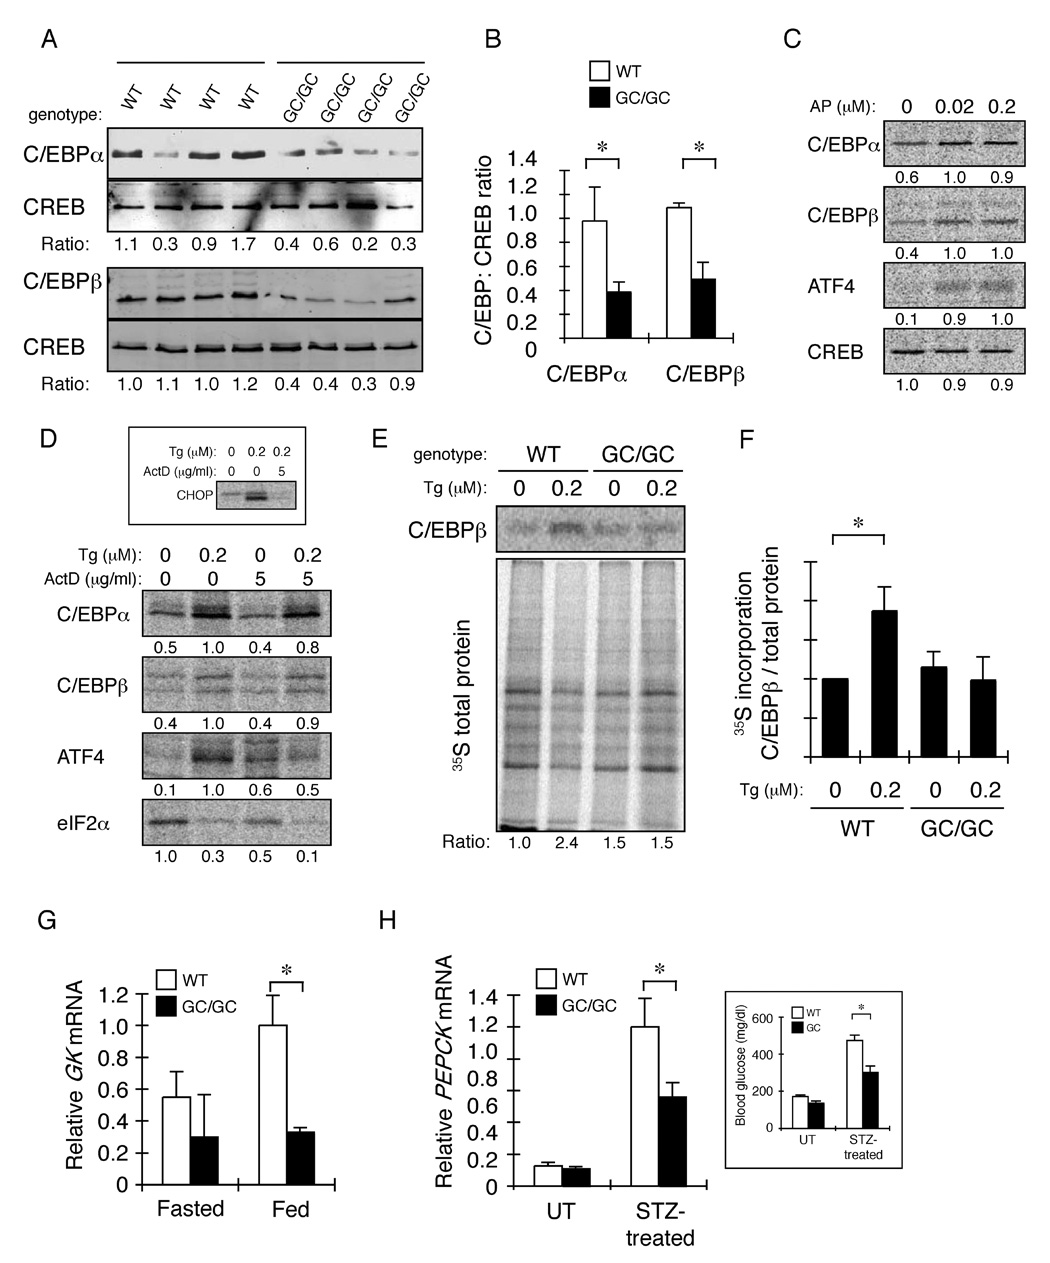
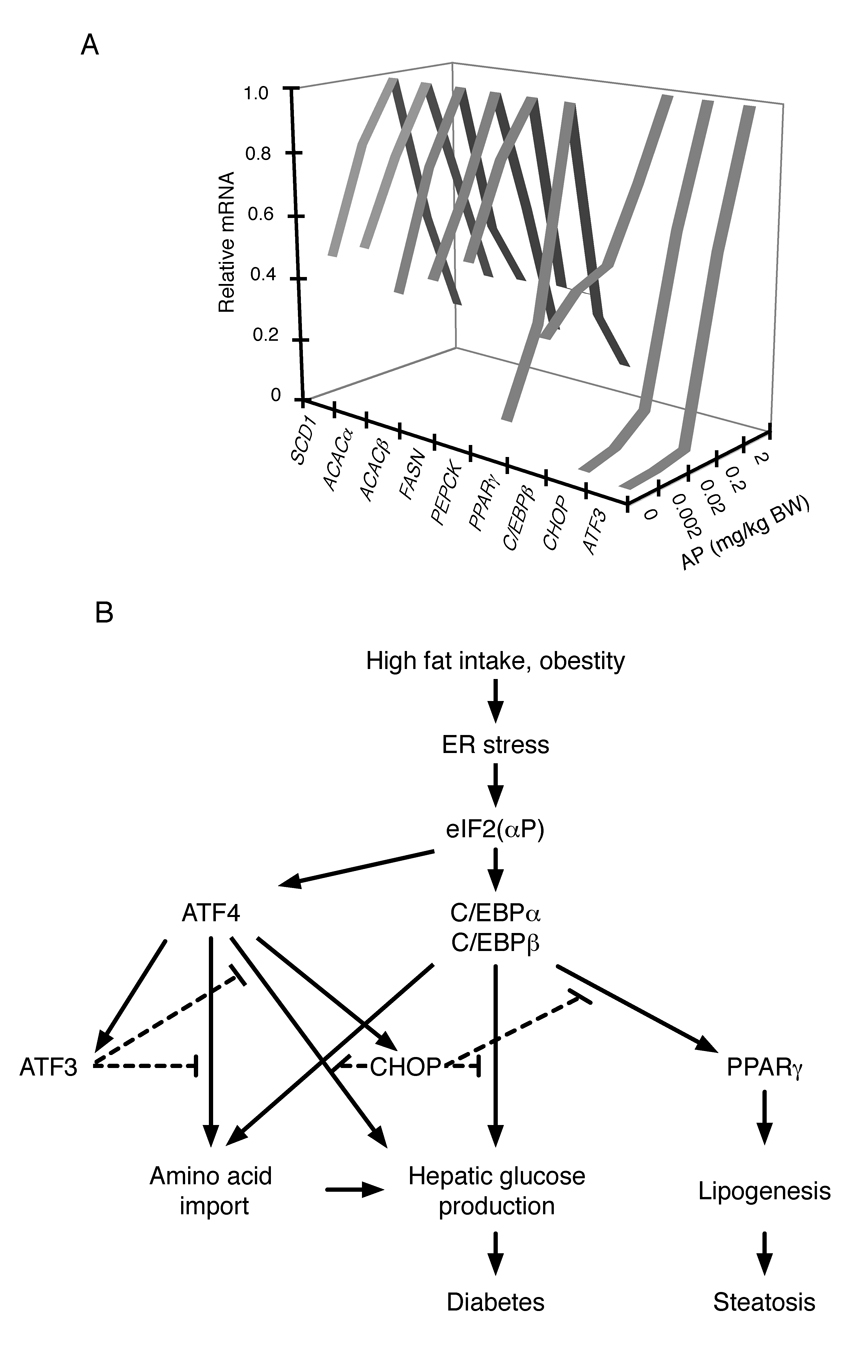
The molecular mechanisms linking the stress of unfolded proteins in the endoplasmic reticulum (ER stress) to glucose intolerance in obese animals are poorly understood. In this study, enforced expression of a translation initiation factor 2alpha (eIF2alpha)-specific phosphatase, GADD34, was used to selectively compromise signaling in the eIF2(alphaP)-dependent arm of the ER unfolded protein response in liver of transgenic mice. The transgene resulted in lower liver glycogen levels and susceptibility to fasting hypoglycemia in lean mice and glucose tolerance and diminished hepatosteatosis in animals fed a high-fat diet. Attenuated eIF2(alphaP) correlated with lower expression of the adipogenic nuclear receptor PPARgamma and its upstream regulators, the transcription factors C/EBPalpha and C/EBPbeta, in transgenic mouse liver, whereas eIF2alpha phosphorylation promoted C/EBP translation in cultured cells and primary hepatocytes. These observations suggest that eIF2(alphaP)-mediated translation of key hepatic transcriptional regulators of intermediary metabolism contributes to the detrimental consequences of nutrient excess.


Figures

Figure 1
Figure 1. Enforced de-phosphorylation of eIF2α blocks the integrated stress response in the liver of transgenic mice
A. Immunoblot of immunopurified GADD34 C-terminal fragment, phosphorylated eIF2α, total eIF2α and immunopurified PERK from liver lysates of untreated (UT) and tunicamycin injected (Tm) non-transgenic (WT), heterozygous (GC/+) and homozygous Alb::GC (GC/GC) transgenic mice. The migration of inactive (PERK0) and active (PERKP) is indicated. B. Immunoblot of immunopurified PERK, phosphorylated eIF2α and total eIF2α from liver lysates of untreated (UT), AP20187 injected (AP) and tunicamycin injected (Tm) non-transgenic (WT) and Ttr::Fv2E-PERK low-expressing transgenic (Fv2E-PERK) mice. The inactive and active endogenous and transgenic Fv2E-PERK proteins are labeled. C. Relative levels of Chop mRNA in liver of Ttr::Fv2E-PERK low-expressing transgenic mice 8 hours after injected with AP20187. Shown are mean ± SEM of a representative experiment (n=3). Linear regression analysis shows correlation factor r2=0.969). D. Relative levels of Chop mRNA in liver after injection with 0.2 mg/Kg AP20187. Shown are mean ± SEM (n=4) of a representative experiment performed in low (p=0.047, one-way ANOVA) and high level expressing lines of Ttr::Fv2E-PERK transgenic mice (p=0.006, one-way ANOVA). E. Expression profiling of ISR target genes revealed by AP20187 treatment of Fv2E-PERK transgenic fibroblasts with wild-type (Eif2aS/S) and mutant (Eif2aA/A) genotypes (“MEFs”) (from Lu et al., 2004b). The induction profile of the same genes in liver of AP20187 injected Ttr::Fv2E-PERK transgenic mice expressing low (n=2) and high (n=4) levels of the transgene is shown below that (data in table S1). The inset at the bottom depicts the expression level of a subset of these validated hepatic ISR target genes (that are induced more that two fold by AP20187 expression in both Ttr::Fv2E-PERK transgenic lines) in high fat diet fed non-transgenic (WT, n=2) and Alb::GC transgenic (n=2) animals (data in table S2).
Figure 2
Figure 2. Fasting hypoglycemia, enhanced insulin sensitivity and reduced glycogen stores in the liver of ISR-defective Alb::GC transgenic mice
A. Body weight (mean ± SEM, n=20) of non-transgenic (WT), heterozygous (GC/+) and homozygous Alb::GC (GC/GC) transgenic male mice as function of age. B. Blood glucose after fasting of adult male mice of indicated genotype (mean ± SEM, n=4, *p<0.05, #p<0.01). C. PAS stain (glycogen) of representative liver sections of fed and fasted mice of the indicated genotype. D. Glycogen content of liver of fed and fasted (18 hr) mice of the indicated genotype (mean ± SEM, WT n=3, Alb::GC n=5, *p<0.05) E. Blood glucose levels as a function of time after pyruvate loading in mice of the indicated genotype (mean ± SEM, n=5, p<0.001 two-way ANOVA). F. Blood glucose as a function of time after intra-peritoneal injection of glucose in mice of the indicated genotype (mean ± SEM, n=3, p<0.001 versus WT by two-way ANOVA) G. Blood glucose as a function of time (expressed as a percent of level at t=0) after intra-peritoneal injection of insulin in mice of the indicated genotype (mean ± SEM, n=4, p=0.005 versus WT by two-way ANOVA)
Figure 3
Figure 3. Sustained insulin sensitivity and reduced hepato-steatosis in ISR-defective Alb::GC transgenic mice on a high fat diet
A. Body weight of a cohort of 12 non-transgenic (WT) and 12 Alb::GC transgenic mice over time (mean ± SEM, p<0.001 versus WT by two-way ANOVA). High fat diet (HFD) was instituted at weaning (3 weeks) whereas the aurothioglucose injection was introduced at 6 weeks of age. B. Blood glucose as a function of time after intra-peritoneal injection of glucose in obese (high fat diet fed) mice of the indicated genotype (mean ± SEM, n=5, p<0.001 versus WT by two-way ANOVA) C. Plasma insulin of the samples from “B” (mean ± SEM, n=5, p<0.001 versus WT by two-way ANOVA). D. Blood glucose as a function of time after intra-peritoneal injection of insulin in obese mice of the indicated genotype (mean ± SEM, n=5, p<0.001 versus WT by two-way ANOVA). E. Hematoxylin and Eosin (HE) and Oil Red O staining of representative liver sections of mice of the indicated genotype fed normal rodent chow (LFD) or high fat diet (HFD). F. Triglyceride content of liver from wildtype and Alb::GC transgenic mice fed a low (LFD) and high fat diet (HFD) (mean ± SEM, n=5, *p<0.05)
Figure 4
Figure 4. Reduced expression of PPARγ and its target lipogenic enzymes in the liver of ISR-defective Alb::GC transgenic mice on a high fat diet
A–E. Relative levels of PPARγ, FASN, ACACβ, ACACα, and SCD1 mRNA in liver of non-transgenic (WT) and Alb::GC transgenic mice in the fasted state or fed a low (LFD and high fat diet) (mean ± SEM, n=3–4, *p<0.05).
Figure 5
Figure 5. Defective expression of C/EBPα and β in the liver of ISR-defective Alb::GC transgenic mice correlates with translational upregulation of C/EBPα and β by the ISR in cultured cells
A. Immunoblot of C/EBPα, C/EBPβ and CREB (a loading control) in nuclear extract of livers of individual animals of the indicated genotype. The ratio of C/EBP:CREB signal in each sample is indicated. B. Graphic presentation of the data in “A” (mean ± SEM, n=4, *p<0.05). C. Autoradiograph of 35S-met/cys labeled endogenous proteins immunoprecipitated from Fv2E-PERK transgenic CHO cells after a 30 minute labeling pulse in the presence of the indicated concentration of AP20187 (AP). The relative signal level in each sample is indicated below each panel. D. Autoradiograph of 35S-met/cys labeled endogenous proteins immunoprecipitated from HepG2 cells after a 30 minute labeling pulse in the presence of the indicated concentration of thapsigragin (Tg) and actinomycin D (ActD). The inset is an autoradiogram of CHOP immunoprecipiated from cells exposed to thapsigragin for 6 hours and and actinomycin D for two hours before the labeling pulse. E Autoradiogram of an experiment identical in design to that shown in “D”, performed on primary hepatocytes obtained from wildtype and Alb::GC mice. The upper panel shows metabolically-labeled immunopurified C/EBPβ and the lower panel metabolically-labeled proteins in the cell lysate. The ratio of label incorporated into C/EBPβ versus total protein, normalized to the untreated WT sample is reported below. Shown is a typical experiment reproduced three times. F. Plot of the ratio of labeled C/EBPβ versus total protein in all experiments performed on untreated and thapsigargin-treated primary hepatocytes from wildtype and Alb::GC transgenic mice. The ratio in the untreated wildtype cells is arbitrarily set to 1 (mean ± S.E.M., n=3, *p<0.05 G. Relative levels of glucokinase (GK) mRNA in liver of fasted and fed non-transgenic (WT) and Alb::GC transgenic mice (mean ± SEM, n=3, *p<0.05). H. Relative levels of PEPCK mRNA in liver of untreated and streptozotocin injected animals of the indicated genotype. The inset is of morning (non-fasted) blood glucose of the same animals.
Figure 6
Figure 6. Biphasic regulation of genes involved in intermediary metabolism by the ISR
A. Relative levels of the indicated mRNA in liver of Ttr::Fv2E-PERK transgenic mice 8 hours after intra-peritoneal injection with the indicated dose of AP20187 (AP). The complete data set and statistical analysis for this experiment is presented in table S5). B. Graphic summary of interactions between components of the ISR regulating intermediary metabolism.

References

    1. Allen-Jennings AE, Hartman MG, Kociba GJ, Hai T. The roles of ATF3 in liver dysfunction and the regulation of phosphoenolpyruvate carboxykinase gene expression. J Biol Chem. 2002;277:20020–20025. - PubMed
    1. Batchvarova N, Wang X-Z, Ron D. Inhibition of adipogenesis by the stress-induced protein CHOP (GADD153) EMBO J. 1995;14:4654–4661. - PMC - PubMed
    1. Bernales S, Papa FR, Walter P. Intracellular signaling by the unfolded protein response. Annu Rev Cell Dev Biol. 2006;22:487–508. - PubMed
    1. Calkhoven CF, Muller C, Leutz A. Translational control of C/EBPalpha and C/EBPbeta isoform expression. Genes Dev. 2000;14:1920–1932. - PMC - PubMed
    1. Chen C, Dudenhausen EE, Pan YX, Zhong C, Kilberg MS. Human CCAAT/enhancer-binding protein beta gene expression is activated by endoplasmic reticulum stress through an unfolded protein response element downstream of the protein coding sequence. J Biol Chem. 2004;279:27948–27956. - PubMed

Publication types