. 2008 Jun 10;105(23):7988-92.
doi: 10.1073/pnas.0711421105. Epub 2008 Jun 3.

Label-free and dynamic detection of biomolecular interactions for high-throughput microarray applications

Affiliations

Label-free and dynamic detection of biomolecular interactions for high-throughput microarray applications

Emre Ozkumur et al. Proc Natl Acad Sci U S A. .

Abstract

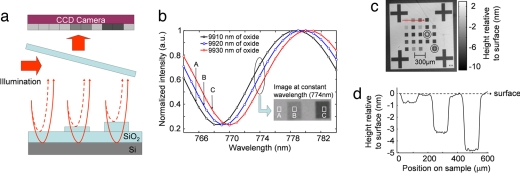
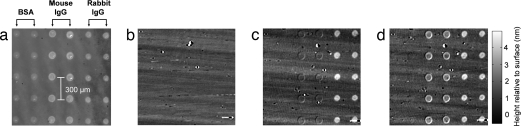
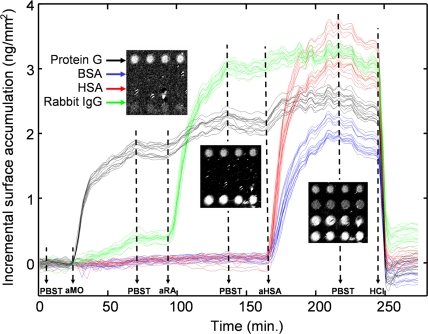
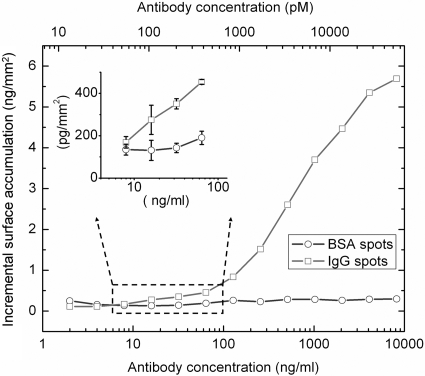
Direct monitoring of primary molecular-binding interactions without the need for secondary reactants would markedly simplify and expand applications of high-throughput label-free detection methods. A simple interferometric technique is presented that monitors the optical phase difference resulting from accumulated biomolecular mass. As an example, 50 spots for each of four proteins consisting of BSA, human serum albumin, rabbit IgG, and protein G were dynamically monitored as they captured corresponding antibodies. Dynamic measurements were made at 26 pg/mm(2) SD per spot and with a detectable concentration of 19 ng/ml. The presented method is particularly relevant for protein microarray analysis because it is label-free, simple, sensitive, and easily scales to high-throughput.


Conflict of interest statement

The authors declare no conflict of interest.

Figures

Fig. 1.
Fig. 1.
Basic principles of SRIB. (a) Simple theory of SRIB. The surface is illuminated with the laser, and the reflected light is imaged on a CCD. Any additional height on the surface will change the optical path difference between the top surface and buried oxide–silicon interface. (b) Data acquisition. The sample reflectance is recorded as an intensity image by a camera at each wavelength in 1-nm steps, forming a reflectivity-vs.-wavelength curve at each pixel of the CCD. Different reflectivity-vs.-wavelength curves are formed as a result of different optical path differences. A high-contrast image is shown as the Inset, at a wavelength of 774 nm, where the slope of the curve is highest. The thickness at each pixel is found by processing these recorded curves and displayed to show the surface profile. (c) System calibration. The SRIB system was calibrated by imaging 25 squares with varying average depths on the chip and comparing the results with the measurements of commercial profilometers. These samples were prepared by standard photolithography. Average etch depth varies from 7.5 to 0.1 nm. Concentric circles are used to find the average height of the square (see Methods). (d) Line cut of the image indicated by the red arrow shown on above image.
Fig. 2.
Fig. 2.
Selective antibody detection. (a) Initial data acquired after washing the spotted sample. Initial heights of the spots were measured to be ≈0.5 nm for BSA spots, ≈1.2 nm for rabbit IgG spots, and ≈1 nm for mouse IgG spots, corresponding to 0.5 ng/mm2, 1.2 ng/mm2, and 1 ng/mm2 of material density on the surface, respectively. All subsequent data were referenced to the initial spotted sample to track the relative biomolecule accumulation. Height information of each image is scaled equally, which is shown with the gray-level scale bar. (b) After subtraction of the reference image. (c) Anti-rabbit incubation. Binding was detected as a 2.5 ng/mm2 incremental surface accumulation at the rabbit IgG spots after 5 μg/ml goat anti-rabbit IgG incubation. (d) Anti-mouse incubation. A 1.5 ng/mm2 incremental surface accumulation at the mouse IgG spots was detected after 5 μg/ml goat anti-mouse IgG incubation.
Fig. 3.
Fig. 3.
Dynamic binding kinetics of different antigens to their antibodies. Kinetics of 64 spots are plotted. The noise floor is 26 pm per spot. Sixteen of the spots are shown at different stages of the experiment as Insets. Solutions are introduced as indicated on the timeline: (PBST) PBS buffer with Tween 20, (aMO) goat anti-mouse IgG, (aRA) goat anti-rabbit IgG, (aHSA) rabbit anti-HSA, (HCl) 20 mM hydrochloric acid. A movie of the binding events is available (Movie S1). Fluctuations on the plots, between the 170th min and 250th min in the timeline, are caused by the laser intensity noises and can be reduced by adjustments and improvements in the optical setup.
Fig. 4.
Fig. 4.
Dilution curve for antibody–antigen interaction. Dilution curves for a pair of IgG–BSA spots are plotted. The sample was incubated in the solutions with increasing concentrations of antibody, each for 45 min., and imaged by SRIB. The antibody concentrations are shown for two different units: nanograms per milliliter and picomoles. Molarity was calculated by assuming the molecular mass of the antibody is 150 kDa. A concentration of 19 ng/ml is clearly detectable for an individual spot, corresponding to ≈120 pM, with a confidence limit of 95%. Because the error bars are very small compared with the height scale of the main plot, a portion of the curve is blown up. The error bars correspond to the standard deviation of measured height of each spot in five consecutive measurements.

References

    1. Engvall E, Perlman P. Enzyme-linked immunosorbent assay (ELISA) Quantitative assay of immunoglobulin G. Immunochemistry. 1971;8:871–874. - PubMed
    1. Gershoni JM, Palade GE. Protein blotting: Principles and applications. Anal Biochem. 1983;131:1–15. - PubMed
    1. Mitchell P. A perspective on protein microarrays. Nat Biotechnol. 2002;20:225–229. - PubMed
    1. Ramachandran N, Larson DN, Stark PRH, Hainsworth E, LaBaer J. Emerging tools for real-time label-free detection of interactions on functional protein microarrays. FEBS J. 2005;272:5412–5425. - PubMed
    1. Homola J, Vaisocherova H, Dostalek J, Piliarik M. Multi-analyte surface Plasmon resonance biosensing. Methods. 2005;37:25–36. - PubMed

Publication types