. 2008 Jun;20(6):1494-503.
doi: 10.1105/tpc.107.056069. Epub 2008 Jun 3.

High-resolution whole-mount imaging of three-dimensional tissue organization and gene expression enables the study of Phloem development and structure in Arabidopsis

Affiliations

High-resolution whole-mount imaging of three-dimensional tissue organization and gene expression enables the study of Phloem development and structure in Arabidopsis

Elisabeth Truernit et al. Plant Cell. 2008 Jun.

Abstract

Currently, examination of the cellular structure of plant organs and the gene expression therein largely relies on the production of tissue sections. Here, we present a staining technique that can be used to image entire plant organs using confocal laser scanning microscopy. This technique produces high-resolution images that allow three-dimensional reconstruction of the cellular organization of plant organs. Importantly, three-dimensional domains of gene expression can be analyzed with single-cell precision. We used this technique for a detailed examination of phloem cells in the wild type and mutants. We were also able to recognize phloem sieve elements and their differentiation state in any tissue type and visualize the structure of sieve plates. We show that in the altered phloem development mutant, a hybrid cell type with phloem and xylem characteristics develops from initially normally differentiated protophloem cells. The simplicity of sieve element data collection allows for the statistical analysis of structural parameters of sieve plates, essential for the calculation of phloem conductivity. Taken together, this technique significantly improves the speed and accuracy of the investigation of plant growth and development.


Figures
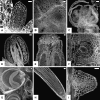
Figure 1.
Figure 1.
mPS-PI–Stained Arabidopsis Organs at Different Developmental Stages. (A) Leaf primordium. (B) Mature leaf with vascular strand. (C) Flower bud. (D) Anther with pollen grains. (E) Silique with developing ovules. (F) Developing ovule in silique. (G) Developing embryos inside their seed coats. (H) Primary root. (I) Lateral root primordium. All images are optical sections taken with a confocal microscope. Bars = 20 μm.
Figure 2.
Figure 2.
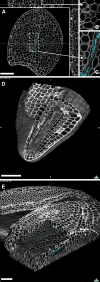
GUS Marker Gene (PD2) Expression and 3D Reconstruction. PD2 marker gene expressing marks specified protophloem cells. Shown are CLSM images showing propidium iodide fluorescence (white) and GUS reflection (blue). Bars = 50 μm. (A) Overview of a cotyledon of PD2 marker line. Digital z-sections through the cotyledon are shown on top and on the right. (B) Magnification of digital z-section showing GUS expression in vascular bundle. (C) Magnification of protophloem strand showing elongated protophloem cells with GUS expression. (D) 3D reconstruction of an Arabidopsis embryonic root and hypocotyl using OsiriX software. Virtual sectioning reveals part of the vasculature and the cellular structure of the epidermis. (E) 3D view of PD2 GUS marker gene expression in the cotyledons of an Arabidopsis embryo. PD2 GUS marker gene expression is seen in immature protophloem cells throughout the vasculature.
Figure 3.
Figure 3.
Features of Differentiating and Differentiated Protophloem Cells after Germination in mPS-PI–Stained Organs. (A) PD1 GUS expression marks differentiating and differentiated protophloem cells in a 5-d-old mPS-PI–stained root (arrow). (B) Differentiating and differentiated protophloem cells can be recognized on the basis of their characteristic shape and their thickened cell walls in the same sample without the need for marker gene expression. (C) and (D) Signal quantification of cell wall fluorescence in protophloem cell file (green line) and neighboring cell file (red line). The graph (D) shows relative signal intensity (I) along the green and red lines shown in (C), with 0 being black and 255 being saturated white (y axis, signal intensity; x axis, micrometers along quantification line). Signal intensity increases specifically in the cell walls of differentiating protophloem cells. (E) Graph showing protophloem cell length (y axis) plotted against the distance from the first cell showing increased fluorescence of its basipetal cell wall in mPS-PI–stained sample (x axis). The zero position on the x axis corresponds to position 1 in (C) and (D). Lengths of cells of protophloem cell files of three roots were measured, and their position relative to the first cell showing cell wall thickening was determined. Each color represents one phloem cell file. (F) PD1 GUS expression in protophloem cells of a leaf primordium (arrow). Thickened cell walls of protophloem cells can be recognized. Differentiation starts from the base of the primordium. (G) Protophloem cell file in mature leaf. (H) Protophloem cell file in floral stalk. Bars = 50 μm.
Figure 4.
Figure 4.
Visualization of Arabidopsis Sieve Plates. CLSM images taken from 60- to 100-μm transverse sections through Arabidopsis Ws stems. (A) to (D) Two-day-old stems. (E) to (H) One-week-old stems. (A) and (E) Overviews of the stem sections. (B) and (F) Vascular bundles with transverse sieve plates. (C) and (G) Longitudinal sieve plates in the same sample. (D) and (H) 3D reconstruction of sieve plates using OsiriX software. A callose plug is visible in (H). Bars = 100 μm in (A) and (E) and 5 μm in (B) to (D) and (F) to (H).
Figure 5.
Figure 5.
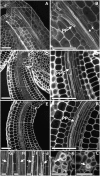
Phloem Development in wol and apl Mutants. (A) Optical section through one protophloem cell file in the root-hypocotyl axis of a 36-h-old wol seedling (Col-0 background). Differentiated protophloem cells can only be seen in the upper part of the hypocotyl. (C) and (E) Corresponding section through the root-hypocotyl axis of an Arabidopsis wild-type (Col-0) (C) seedling and apl (E) seedling. Differentiated protophloem cells form a continuous file. (B), (D), and (F) Higher magnifications of the insets in (A), (C), and (E), respectively. Arrows show the protophloem cells. (G) Xylem cell file of an Arabidopsis root 3-d after germination. (H) Protophloem cell file of the same root. (I) Xylem cell file in an apl root 3 d after germination. (J) Protophloem cell file of the same root showing xylem characteristics. (K) Longitudinal sieve plate (arrow) in the hypocotyl of an apl plant. (L) Transverse sieve plate in the same sample. PP, protophloem cell; X, xylem cell. Bars = 50 μm in (A) to (F) and 10 μm in (G) to (L).

Comment in

References

    1. Bauby, H., Divol, F., Truernit, E., Grandjean, O., and Palauqui, J.C. (2007). Protophloem differentiation in early Arabidopsis thaliana development. Plant Cell Physiol. 48 97–109. - PubMed
    1. Bechtold, N., Ellis, J., and Pelletier, G. (1993). In planta Agrobacterium mediated gene transfer by infiltration of adult Arabidopsis thaliana plants. C. R. Acad. Sci. III, Sci. Vie Life Sci. 316 1194–1199.
    1. Birnbaum, K., Shasha, D.E., Wang, J.Y., Jung, J.W., Lambert, G.M., Galbraith, D.W., and Benfey, P.N. (2003). A gene expression map of the Arabidopsis root. Science 302 1956–1960. - PubMed
    1. Bonke, M., Thitamadee, S., Mahonen, A.P., Hauser, M.T., and Helariutta, Y. (2003). APL regulates vascular tissue identity in Arabidopsis. Nature 426 181–186. - PubMed
    1. Bougourd, S., Marrison, J., and Haseloff, J. (2000). Technical advance: An aniline blue staining procedure for confocal microscopy and 3D imaging of normal and perturbed cellular phenotypes in mature Arabidopsis embryos. Plant J. 24 543–550. - PubMed

Publication types

MeSH terms