. 2008;65(1-2):19-44.
doi: 10.1159/000130014. Epub 2008 May 28.

Spectral integration of dynamic cues in the perception of syllable-initial stops

Affiliations

Spectral integration of dynamic cues in the perception of syllable-initial stops

Robert Allen Fox et al. Phonetica. 2008.

Abstract

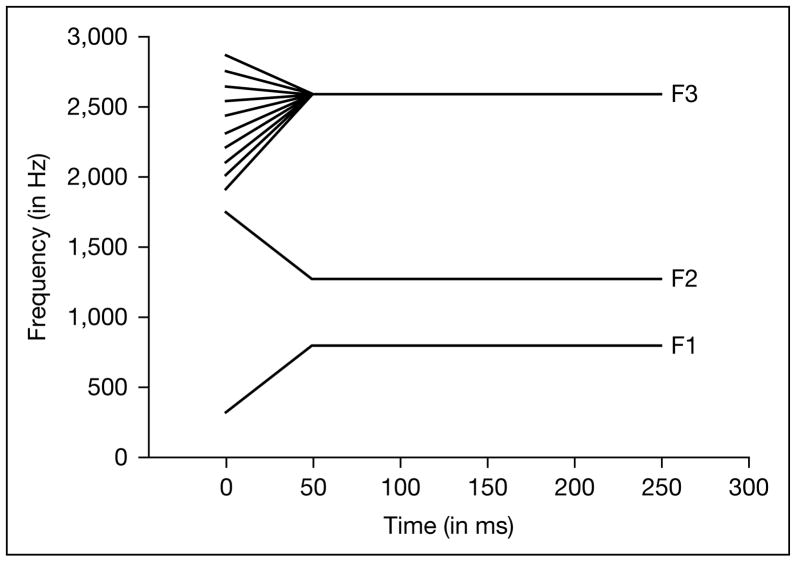
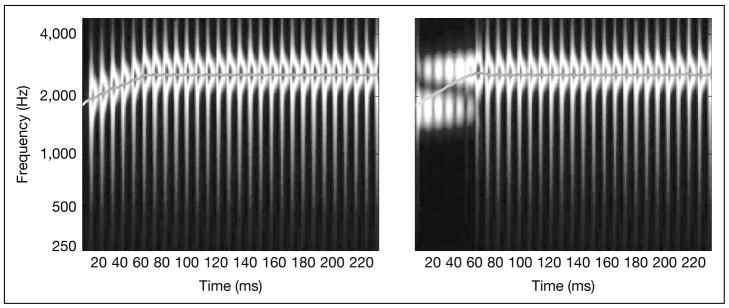
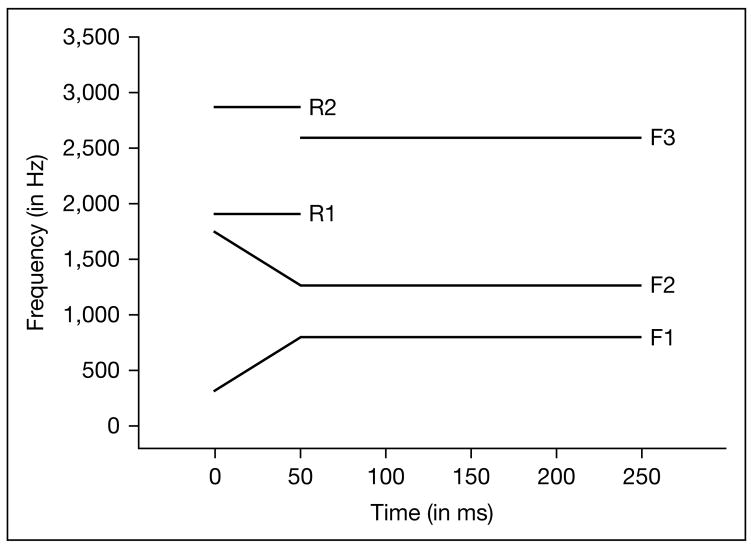
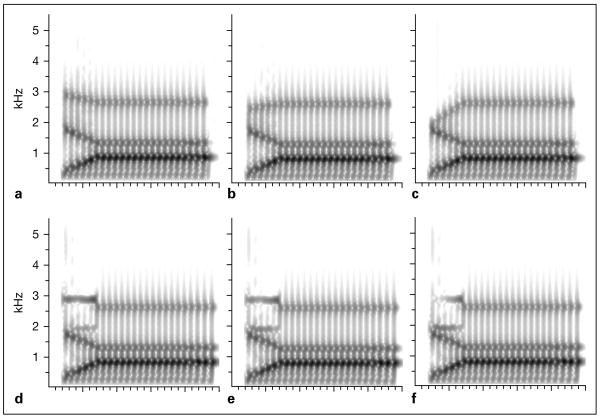
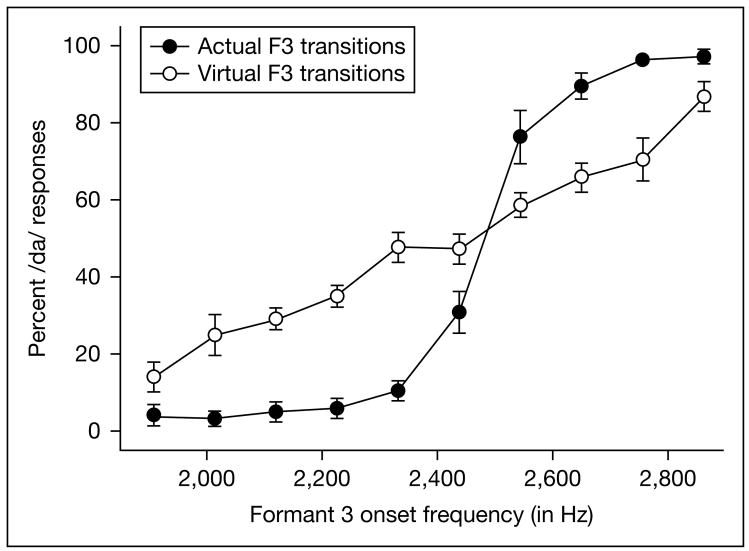
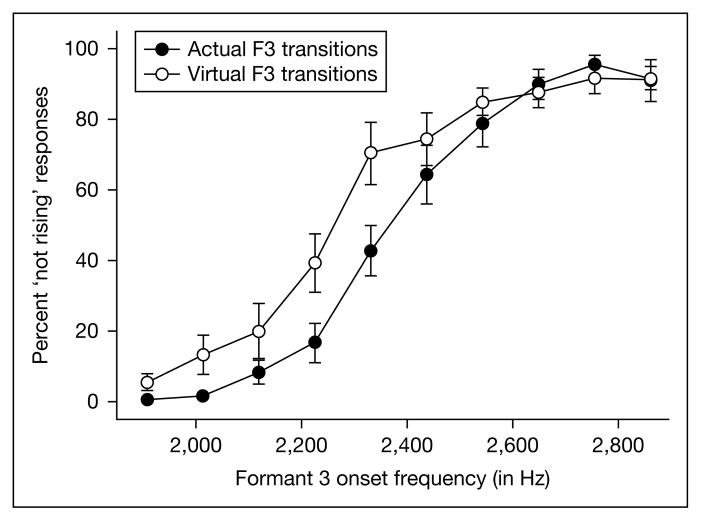
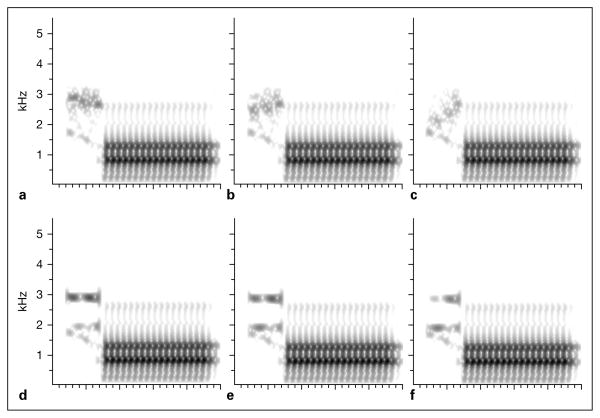
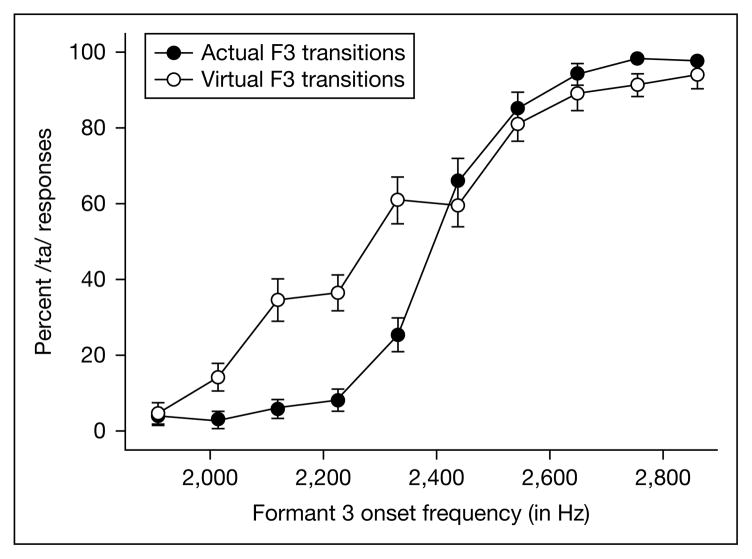
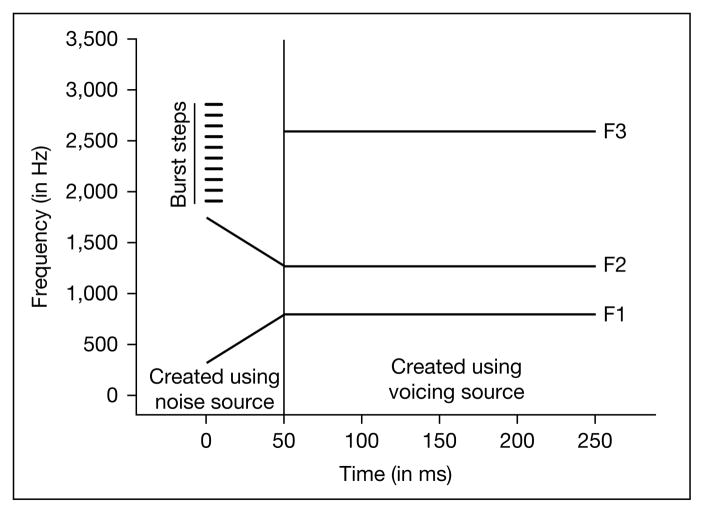
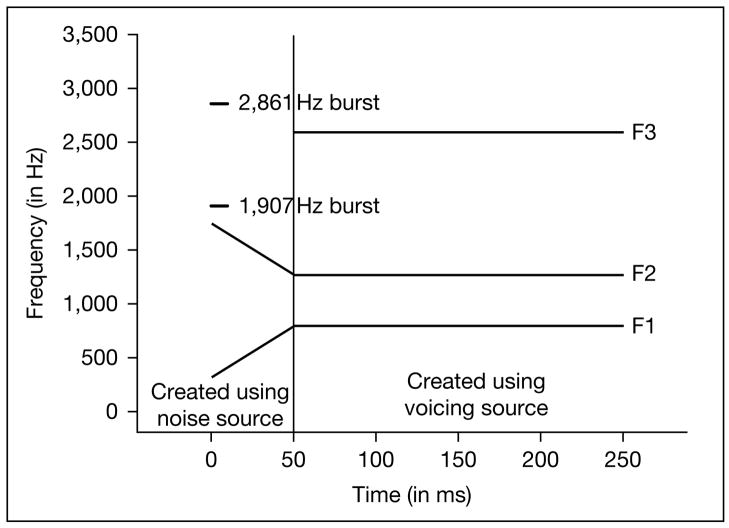
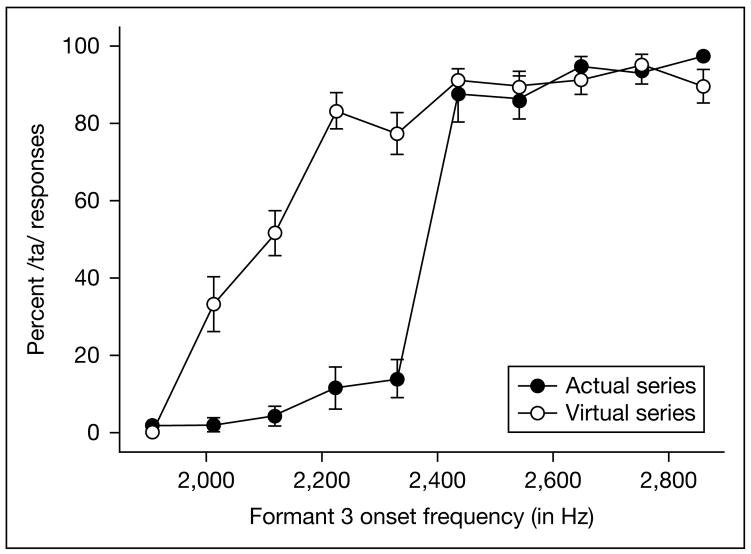
The present experiments examine the potential role of auditory spectral integration and spectral center of gravity (COG) effects in the perception of initial formant transitions in the syllables [da]-[ga] and [t(h)a]-[k(h)a]. Of interest is whether the place distinction for stops in these syllables can be cued by a 'virtual F3 transition' in which the percept of a frequency transition is produced by a dynamically changing COG. Listeners perceived the virtual F3 transitions comparably with actual F3 transitions although the former were less salient a cue. However, in a separate experiment, static 'virtual F3 bursts' were not as effective as actual F3 bursts in cueing the alveolar-velar place distinction. These results indicate that virtual F3 transitions can provide phonetic information to the perceptual system and that auditory spectral integration (completed by the central auditory system) may play a significant role in speech perception.


Figures

Fig. 1
Fig. 1
Schematic representation of the actual F3 transition series; note that the frequency of the F3 onset varies from 1,907 to 2,596 Hz.
Fig. 2
Fig. 2
The perceived frequency of the actual (left) and the virtual F3 transition (right) as predicted by the IWAIF model. The steady-state portions of F3 are also included.
Fig. 3
Fig. 3
Schematic representation of the virtual F3 transition series; note that the center frequencies of the two 50-ms noise-excited resonances remain constant.
Fig. 4
Fig. 4
Spectrograms of the endpoint stimuli (a, c) and an intermediate stimulus (b) for the actual [da]-[ga] series. The versions of these tokens containing virtual F3 transitions are displayed in d, f and e, respectively.
Fig. 5
Fig. 5
Identification functions of responses to the actual F3 transition and the virtual F3 transition series. Values along the abscissa represent the onset F3 frequency used in the synthesis of the actual formant transition or, for the virtual transitions, the effective onset frequency of the IWAIF-modeled spectral COG for the two noise-excited resonances.
Fig. 6
Fig. 6
Identification functions (rising/not rising) of responses to the actual F3 transitions and the virtual F3 transition series. Values along the abscissa represent the onset F3 frequency used in the synthesis of the actual formant transition or, for the virtual transitions, the effective onset frequency of the IWAIF-modeled COG for the two noise-excited resonances.
Fig. 7
Fig. 7
Spectrograms of the endpoint stimuli (a, c) and an intermediate stimulus (b) for the actual [tha]-[kha] series. The versions of these tokens containing virtual F3 transitions are displayed in d, f and e, respectively.
Fig. 8
Fig. 8
Identification functions of responses to the actual F3 transition voiceless series and the virtual F3 transition voiceless series. Values along the abscissa represent the onset F3 frequency used in the synthesis of the actual formant transition or, for the virtual transitions, the effective onset frequency of the IWAIF-modeled spectral COG for the two noise-excited resonances.
Fig. 9
Fig. 9
Schematic representation of the actual F3 burst series; each stimulus token in the series uses the [tha]-[kha] base token.
Fig. 10
Fig. 10
Schematic representation of the virtual F3 burst series; each stimulus token in the series uses the [tha]-[kha] base token.
Fig. 11
Fig. 11
Identification functions of responses to the actual and virtual F3 burst series. Values along the abscissa represent the onset F3 frequency used in the synthesis of the actual F3 burst or, for the virtual F3 bursts, the effective onset frequency of the IWAIF-modeled spectral COG for the bursts centered at 1,907 and 2,861 Hz.

References

    1. Anantharaman JN, Krishnamurthy AK, Feth L. Intensity-weighted average of instantaneous frequency as a model for frequency discrimination. J acoust Soc Am. 1993;94:723–729. - PubMed
    1. Assmann PF. The perception of back vowels: centre of gravity hypothesis. Q Jl exp Psychol. 1991;43:423–448. - PubMed
    1. Beddor PS, Hawkins S. The influence of spectral prominence on perceived vowel quality. J acoust Soc Am. 1990;87:2684–2704. - PubMed
    1. Bedrov YA, Chistovich LA, Sheikin RL. Frequency location of the ‘center of gravity’ of formants as a useful feature in vowel perception. Akust Zh . 24:480–486.
    2. Soviet Phys Acoust. 1978;24:275–282.
    1. Bladon A. Two-formant models of vowel perception: shortcomings and enhancements. Speech Commun. 1983;2:305–313.

Publication types