

A low dose of dietary resveratrol partially mimics caloric restriction and retards aging parameters in mice
- PMID: 18523577
- PMCID: PMC2386967
- DOI: 10.1371/journal.pone.0002264
A low dose of dietary resveratrol partially mimics caloric restriction and retards aging parameters in mice
Erratum in
- PLoS ONE. 2008;3(6). doi: 10.1371/annotation/7d56e94e-3582-413d-b987-fccd0da79081 doi: 10.1371/annotation/7d56e94e-3582-413d-b987-fccd0da79081
- PLoS ONE. 2008;3(6). doi: 10.1371/annotation/8333176c-b08c-4dfb-a829-6331c0fc6064 doi: 10.1371/annotation/8333176c-b08c-4dfb-a829-6331c0fc6064
- PLoS ONE. 2008;3(6). doi: 10.1371/annotation/c54ef754-1962-4125-bf19-76d3ec6f19e5 doi: 10.1371/annotation/c54ef754-1962-4125-bf19-76d3ec6f19e5
Abstract
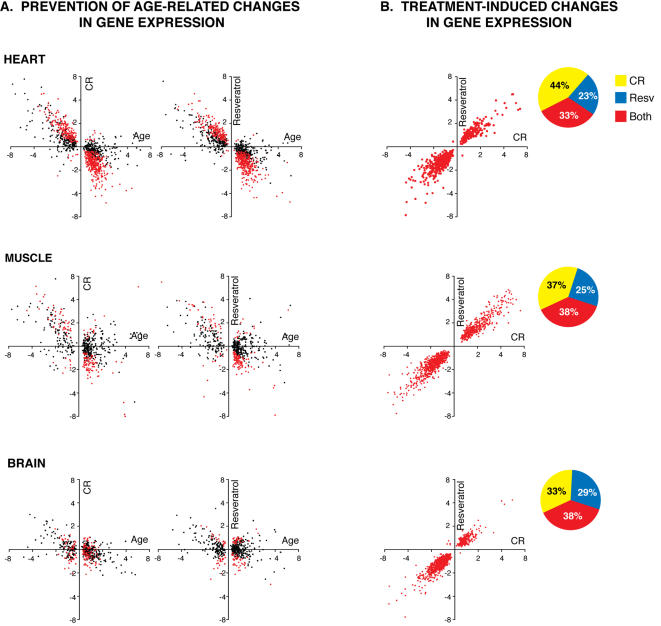
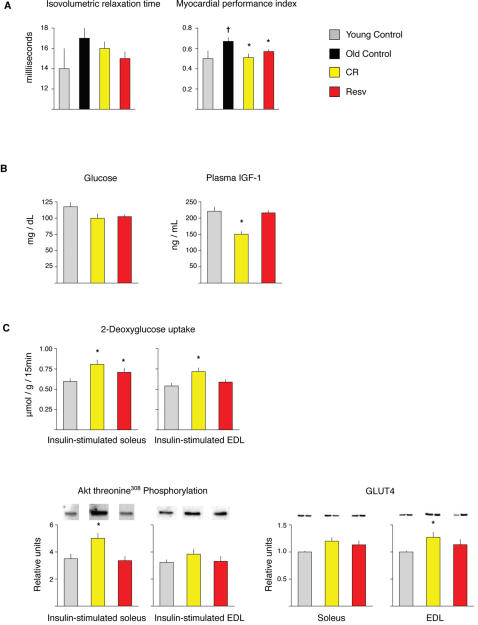
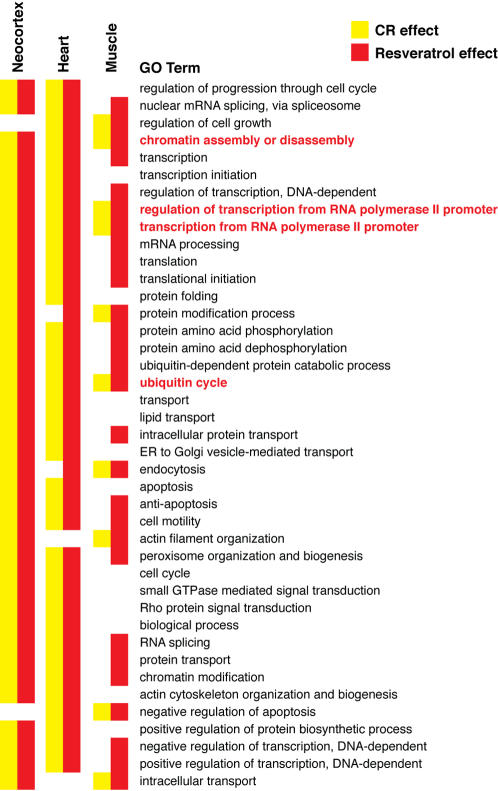
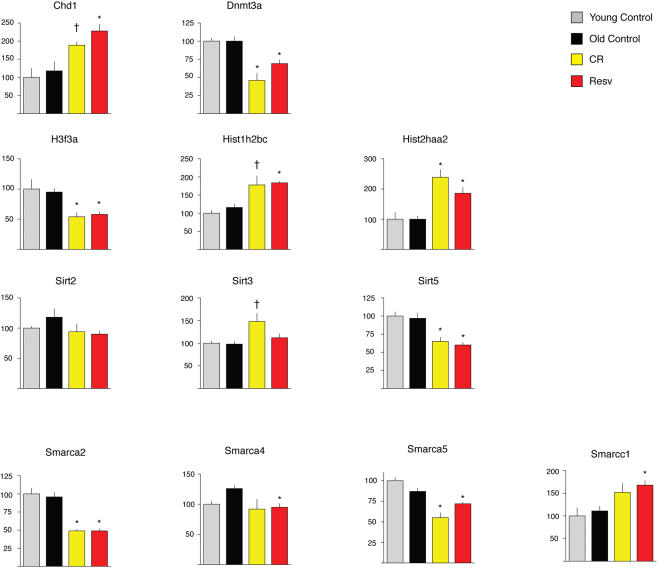
Resveratrol in high doses has been shown to extend lifespan in some studies in invertebrates and to prevent early mortality in mice fed a high-fat diet. We fed mice from middle age (14-months) to old age (30-months) either a control diet, a low dose of resveratrol (4.9 mg kg(-1) day(-1)), or a calorie restricted (CR) diet and examined genome-wide transcriptional profiles. We report a striking transcriptional overlap of CR and resveratrol in heart, skeletal muscle and brain. Both dietary interventions inhibit gene expression profiles associated with cardiac and skeletal muscle aging, and prevent age-related cardiac dysfunction. Dietary resveratrol also mimics the effects of CR in insulin mediated glucose uptake in muscle. Gene expression profiling suggests that both CR and resveratrol may retard some aspects of aging through alterations in chromatin structure and transcription. Resveratrol, at doses that can be readily achieved in humans, fulfills the definition of a dietary compound that mimics some aspects of CR.
Conflict of interest statement
Figures
References
-
- Weindruch R, Walford RL. Springfield, Ill.: Charles C Thomas; 1988. The Retardation of Aging and Disease By Dietary Restriction. p. 436.
-
- Lee CK, Klopp RG, Weindruch R, Prolla TA. Gene expression profile of aging and its retardation by caloric restriction. Science. 1999;285:1390–1393. - PubMed
-
- Howitz KT, Bitterman KJ, Cohen HY, Lamming DW, Lavu S, et al. Small molecule activators of sirtuins extend Saccharomyces cerevisiae lifespan. Nature. 2003;425:191–196. - PubMed
-
- Wood JG, Rogina B, Lavu S, Howitz K, Helfand SL, et al. Sirtuin activators mimic caloric restriction and delay ageing in metazoans. Nature. 2004;430:686–689. - PubMed
-
- Kaeberlein M, McDonagh T, Heltweg B, Hixon J, Westman EA, et al. Substrate-specific activation of sirtuins by resveratrol. J Biol Chem. 2005;280:17038–17045. - PubMed
Publication types
MeSH terms
Substances
Grants and funding
- K01 AG000908/AG/NIA NIH HHS/United States
- Z01 AG000908/ImNIH/Intramural NIH HHS/United States
- R01 AG017994/AG/NIA NIH HHS/United States
- R01 DK048831/DK/NIDDK NIH HHS/United States
- AG17994/AG/NIA NIH HHS/United States
- P01 GM015431/GM/NIGMS NIH HHS/United States
- P50 GM015431/GM/NIGMS NIH HHS/United States
- R01 AG021042/AG/NIA NIH HHS/United States
- ES13125/ES/NIEHS NIH HHS/United States
- AG-000908/AG/NIA NIH HHS/United States
- R01 AG020681/AG/NIA NIH HHS/United States
- P01 ES013125/ES/NIEHS NIH HHS/United States
- DK48831/DK/NIDDK NIH HHS/United States
- GM15431/GM/NIGMS NIH HHS/United States
- AG020681/AG/NIA NIH HHS/United States
- P30 AG028740/AG/NIA NIH HHS/United States
- AG21042/AG/NIA NIH HHS/United States
LinkOut - more resources
Full Text Sources
Other Literature Sources
Medical
Molecular Biology Databases
