Review
. 2008 Oct;18(5):338-48.
doi: 10.1016/j.semcancer.2008.03.018. Epub 2008 Apr 1.

Invasion emerges from cancer cell adaptation to competitive microenvironments: quantitative predictions from multiscale mathematical models

Affiliations
Review

Invasion emerges from cancer cell adaptation to competitive microenvironments: quantitative predictions from multiscale mathematical models

Vito Quaranta et al. Semin Cancer Biol. 2008 Oct.

Abstract

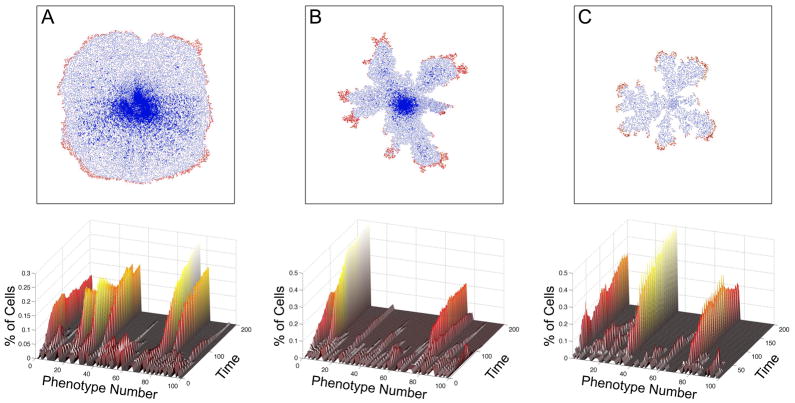
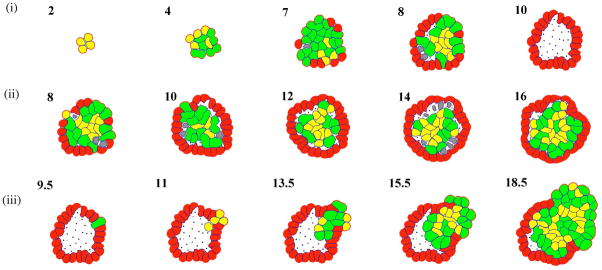
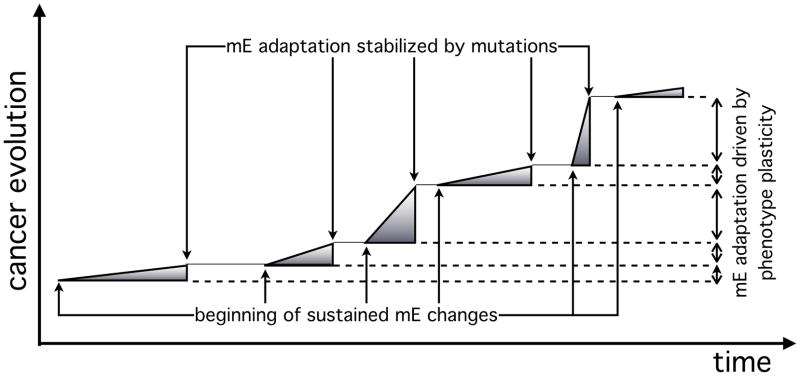
In this review we summarize our recent efforts using mathematical modeling and computation to simulate cancer invasion, with a special emphasis on the tumor microenvironment. We consider cancer progression as a complex multiscale process and approach it with three single-cell-based mathematical models that examine the interactions between tumor microenvironment and cancer cells at several scales. The models exploit distinct mathematical and computational techniques, yet they share core elements and can be compared and/or related to each other. The overall aim of using mathematical models is to uncover the fundamental mechanisms that lend cancer progression its direction towards invasion and metastasis. The models effectively simulate various modes of cancer cell adaptation to the microenvironment in a growing tumor. All three point to a general mechanism underlying cancer invasion: competition for adaptation between distinct cancer cell phenotypes, driven by a tumor microenvironment with scarce resources. These theoretical predictions pose an intriguing experimental challenge: test the hypothesis that invasion is an emergent property of cancer cell populations adapting to selective microenvironment pressure, rather than culmination of cancer progression producing cells with the "invasive phenotype". In broader terms, we propose that fundamental insights into cancer can be achieved by experimentation interacting with theoretical frameworks provided by computational and mathematical modeling.


Figures

Figure 1
Figure 1
Schematic of different model layouts: (left panel) A cluster of tumour cells in the EHCA and HDC models (colouration denoting cell state). The cells reside on a square lattice and each lattice site can either be occupied by a cancer cell or be empty. Note, the EHCA model does not consider MDE (Matrix Degrading Enzymes) or ECM (Extracellular Matrix). (right panel) A portion of a small cluster of adherent cells in the IBCell model. Cell boundary points (dots) are connected by short linear springs to form plasma membranes (grey lines); nuclei (circles inside cells) are surrounded by cytoplasm modeled as a viscous incompressible Newtonian fluid; cells are connected by adherent links (thin black lines); adhesive and growth membrane receptors are distributed along the cell boundary.
Figure 2
Figure 2
Simulation results from all three models for tumors grown under a range of mE background oxygen levels (k) and cell hypoxia tolerance thresholds (h): HDC (upper figure in each square), EHCA (left figure in each square) and IBCell (right figure in each square). Both parameters (k and h) influence the morphology of the tumour: increasing k reduces size and produces fingering, increasing h has a similar, albeit more subtle effect. Colouration for cell types: red (proliferating); green (quiescent); blue (dead).
Figure 3
Figure 3
Growth simulation outcomes from the IBCell model. (Upper row): Spatial distribution of cells after 11 cell divisions. Under different mE and hypoxia tolerances, three distinct growth patterns are observed: (left) solid tumours (nutrient-rich mE, normal hypoxia tolerance), (center) tumours with fingering margins (nutrient-scapoorrce mE, normal hypoxia threshold), (right) tumours in growth arrest (nutrient-poor mE, low hypoxia tolerance). (Lower row): Distribution of all cells according to the concentration of nutrients sensed by each cell and the percentage of free growth receptors. Horizontal lines represent the hypoxic tolerance level. Vertical lines represent the 20% growth threshold. Cells colouration denotes cell state: growing (red), quiescent (green), hypoxic (blue).
Figure 4
Figure 4
Growth simulation outcomes from the EHCA model. (Left panels): Spatial distribution of cells in an oxygen switching experiment. In high oxygen mE, the tumour consists mostly of quiescent cells and grows with a round morphology, while in low oxygen mE the tumour is dominated by dead cells and displays a fingering morphology (outcomes of two independent simulations are shown). (Line graph on the right): Time evolution of the phenotypes in the simulations on the left panels. The most abundant phenotypes have been highlighted and their response vectors are displayed - the vector takes the form of three probabilities for (proliferation, quiescence, apoptosis), so that (1,0,0) means the probability of proliferation is 1, i.e., it will always occur.
Figure 5
Figure 5
Growth simulation outcomes from the HDC model under three different mE: (A) uniform ECM, (B) Grainy ECM and (C) Low nutrient. (Upper row): Spatial tumor cell distributions after 3 months of simulated growth shows that the three different microenvironments have produced distinct tumour morphologies. In particular, the homogeneous ECM distribution has produced a large tumor with smooth margins (A) containing a dead cell inner core and a thin rim of proliferating cells. The tumour in the grainy ECM also has a dead inner core with a thin rim of proliferating cells, however, it displays a striking, branched fingered morphology at the margins (B). This fingering morphology is also observed in the low nutrient simulation, which produced the smallest tumour (C). (Lower row): Relative abundance of the 100 tumour phenotypes as the tumour grew in the different mE: approximately 6 dominant phenotypes in the uniform tumour, 2 in the grainy and 3 in the low nutrient tumour. These phenotypes have several traits in common: low cell-cell adhesion, short proliferation age, and high migration coefficients. In each tumour, one of the phenotypes is the most aggressive and also the most abundant, particularly in B and C. All parameters used in the simulations are identical with the exception of the different mE.
Figure 6
Figure 6
IBCell simulation outcomes. (i) Consecutive stages in the development of a normal hollow acinus from a small cluster of viable cells to an acinar structure composed of a complete outer layer of polarised cells surrounding a hollow luminal space; (ii) Formation of an abnormal acinus with a complete outer layer of polarised cells and an inner core of cells that fail to become growth suppressed and fill the luminal space; (iii) Formation of an abnormal acinus with a cohort of invasive cells arising from a polarization-deficient precursor cell, which deform the outer layer and break through to the outside and to the luminal space. Numbers indicate completed rounds of cell divisions. Cell phenotypes are coloured as follows: resting viable cells (yellow); growing cells (green); polarised cells (red); apoptotic cells (grey); dead cells (black dots).
Figure 7
Figure 7
A schematic plot of cancer evolution as a function of time, driven by two distinct adaptive strategies. Initially a well-adapted phenotype is pushed to operate at one extreme of its plasticity range, in order to adapt to changes in the mE. A random genetic mutation in its progeny stabilizes this effect and creates a phenotype well-adapted to the new mE. This process then repeats and leads to further rounds of phenotype adaptation and genotype stabilization (possibly based on additional mutation events), producing a mix of phenotypes with distinct adaptation and adaptability values. At any point in this process, invasion may emerge if a harsh mE (e.g., nutrient- or oxygen-poor) develops and drives competition between these phenotypes (see figure 2).

References

    1. Armitage P. Multistage models of carcinogenesis. Environ Health Perspect. 1985;63:195–201. - PMC - PubMed
    1. Moolgavkar SH, Luebeck EG. Multistage carcinogenesis and the incidence of human cancer. Genes Chromosomes Cancer. 2003;38(4):302–6. - PubMed
    1. Knudson AG. Two genetic hits (more or less) to cancer. Nat Rev Cancer. 2001;1(2):157–62. - PubMed
    1. Lee WH, Bookstein R, Hong F, Young LJ, Shew JY, Lee EY. Human retinoblastoma susceptibility gene: cloning, identification, and sequence. Science. 1987;235(4794):1394–9. - PubMed
    1. Weinberg RA. Oncogenes and tumor suppressor genes. CA Cancer J Clin. 1994;44(3):160–70. - PubMed

Publication types