Comparative Study
. 2008 Jun 4;28(23):5879-90.
doi: 10.1523/JNEUROSCI.5331-07.2008.

A molecular clutch between the actin flow and N-cadherin adhesions drives growth cone migration

Affiliations
Comparative Study

A molecular clutch between the actin flow and N-cadherin adhesions drives growth cone migration

Lucie Bard et al. J Neurosci. .

Abstract

The adhesion molecule N-cadherin plays important roles in the development of the nervous system, in particular by stimulating axon outgrowth, but the molecular mechanisms underlying this effect are mostly unknown. One possibility, the so-called "molecular clutch" model, could involve a direct mechanical linkage between N-cadherin adhesion at the membrane and intracellular actin-based motility within neuronal growth cones. Using live imaging of primary rat hippocampal neurons plated on N-cadherin-coated substrates and optical trapping of N-cadherin-coated microspheres, we demonstrate here a strong correlation between growth cone velocity and the mechanical coupling between ligand-bound N-cadherin receptors and the retrograde actin flow. This relationship holds by varying ligand density and expressing mutated N-cadherin receptors or small interfering RNAs to perturb binding to catenins. By restraining microsphere motion using optical tweezers or a microneedle, we further show slippage of cadherin-cytoskeleton bonds at low forces, and, at higher forces, local actin accumulation, which strengthens nascent N-cadherin contacts. Together, these data support a direct transmission of actin-based traction forces to N-cadherin adhesions, through catenin partners, driving growth cone advance and neurite extension.


Figures

Figure 1.
Figure 1.
Effect of Ncad-Fc density on neurite length and growth cone velocity. Primary neurons were plated on glass coverslips coated with various dilutions of Ncad-Fc, cad11-Fc, synCAM-Fc, or Fc and observed 2 d later. A, Images for Ncad-Fc and synCAM-Fc substrates (coating density, 1 μg/cm2), where the longest neurite is outlined. B, Time-lapse images of growth cones moving on Ncad-Fc or Fc substrates. We specifically selected growth cones from the longest neurites. C, The positions of individual growth cone centroids were tracked, and their displacement was plotted over time. D, Correlation between growth cone velocity and length of the longest neurite, including all conditions. The average neurite length was calculated from 10–54 cells, and the average velocity was obtained from 11–64 individual growth cones per condition. SynCAM and Cad-11 (open circles) are not taken into account for the correlation.
Figure 2.
Figure 2.
Relationship between receptor–cytoskeleton anchoring and growth cone velocity. A–F, Latex microspheres (1 μm) coated with high Ncad-Fc density (A, D), medium Ncad-Fc density (B, E), or Fc alone (C, F) were either placed for 2 s at the periphery of growth cones using optical tweezers and then left alone for 2 min (top left diagram, A–C) or restrained by continuous application of the optical trap (top right diagram, D–F). A–C, Beads are shown at time 0, and red traces represent 2 min trajectories. D–F, Dashed lines represent the position of the trap and the time after initial contact is indicated. G, The mean squared displacement from each trajectory was plotted over time (t) and fitted by the equation 4Dt + V2t2, where D and V are the diffusion coefficient and the mean velocity of the bead, respectively (3 individual examples are shown). χ2 values obtained with this two-parameter equation were substantially lower than for a single component equation, indicating a better fit (e.g., for the intermediate Ncad-Fc coating, χ2 = 0.06 for the double component, χ2 = 2.1 for flow only, and χ2 = 3.3 for diffusion alone). H, Correlation between coupling index and growth cone velocity for the various Ncad-Fc dilutions. The average coupling index was calculated for a total of 10–38 individual beads per condition.
Figure 3.
Figure 3.
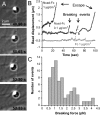
Breaking events displayed by optically restrained N-cadherin-coated microspheres. A, A microsphere coated with 0.1 μg/cm2 Ncad-Fc starts to escape 50 s after initial contact and then quickly comes back into the trap center. The dashed line indicates the equilibrium trapping position. B, Corresponding graph showing the distance traveled by the bead with respect to the trap center, versus time. Two breaking events (arrows) were identified in this example (dark gray trace). Final escape appears as a sudden linear increase in displacement over time. Beads coated with 1 μg/cm2 Ncad-Fc escape rapidly (black trace), whereas beads coated with Fc alone stay indefinitely in the trap (bottom gray trace). For clarity, the 1 μg/cm2 Ncad-Fc and Fc traces have been moved up and down by 0.5 μm, respectively. C, Force histogram of all breaking events.
Figure 4.
Figure 4.
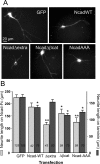
Effect of mutated N-cadherin receptors on neurite outgrowth. Neurons were plated on coverslips coated with 0.3 μg/cm2 Ncad-Fc or 5 μg/cm2 laminin, transfected at 1 DIV with GFP, Ncad-GFP, GFP + NcadΔextra, NcadΔβcat-GFP, or NcadAAA-YFP, and observed at 2 DIV. A, Representative GFP fluorescence images for GFP-tagged receptors and anti-myc tag immunostaining for Ncad-Δextra. B, The length of the longest neurite is plotted for each transfection. The mean lengths obtained for the N-cadherin mutants are compared by ANOVA to the control GFP transfection in each substrate condition. *p < 0.05; **p < 0.01. Error bars indicate SEM.
Figure 5.
Figure 5.
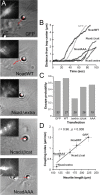
Effect of mutated N-cadherin receptors on receptor–cytoskeleton coupling. Neurons cultured on polylysine were transfected at 1 DIV with each of the five plasmids. At 2 DIV, microspheres coated with 0.3 μg/cm2 Ncad-Fc were maintained on growth cones for 2 min by applying optical tweezers continuously. A, Representative DIC images and corresponding fluorescence images of GFP-tagged proteins (insets) are presented for each condition. Untagged NcadΔextra was cotransfected with GFP at a 4:1 ratio, and we checked by retrospective immunostaining that all GFP-positive neurons also expressed NcadΔextra. Beads are shown at time 0 and trajectories truncated at 1 min are in red. B, Corresponding displacements versus time. C, Fraction of beads escaping the trap in <1 min. D, Coupling index versus neurite length for all transfections. *p < 0.05; **p < 0.01.
Figure 6.
Figure 6.
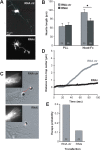
Effect of α-catenin silencing on neurite outgrowth and N-cadherin–cytoskeleton coupling. Neurons were plated on coverslips coated with 0.3 μg/cm2 Ncad-Fc or polylysine, transfected 6 h after seeding with GFP + αE-catenin RNAi duplexes or GFP + RNActr, and processed at 2 DIV. A, Effect of αE-catenin siRNA or RNActr on neurite extension on Ncad-Fc. B, Length of the longest neurite quantified for the two transfections and the two types of substrates, showing a strong effect of αE-catenin siRNA on neurite extension on Ncad-Fc, but not on polylysine (PLL). C–E, Microspheres coated with 0.3 μg/cm2 Ncad-Fc were placed on the growth cones of neurons plated on polylysine and transfected with either αE-catenin siRNA or RNActr as the optical trap was applied continuously. C, One example of each condition: red traces represent 2 min trajectories superimposed on the DIC images, and the insets show the corresponding GFP fluorescence. D, Corresponding displacement versus time plot for these two examples, showing that the bead escapes the trap at 40 s in the case of RNActr, but does not escape before 100 s in the case of RNAi. E, Probability of escape from the trap before 1 min, computed for ∼30 beads in each condition (24–30 neurons for each experiment). Error bars indicate SEM. *p < 0.05.
Figure 7.
Figure 7.
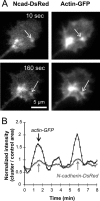
Actin accumulation at basal N-cadherin clusters. Neurons plated on Ncad-Fc-coated coverslips were cotransfected with Ncad-DsRed and actin-GFP (1:1). We took care to focus at the substrate level to reveal N-cadherin distribution at the basal membrane. A, Example of a growth cone showing transient formation of N-cadherin clusters (arrows) paralleled by a dramatic accumulation of actin. B, Example of an N-cadherin cluster that formed and disappeared several times at the same location. The GFP and DsRed fluorescence intensities at the cluster were normalized to those in a nearby region and plotted over time.
Figure 8.
Figure 8.
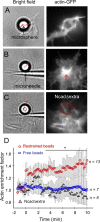
Local actin accumulation at restrained Ncad-Fc microspheres. A–C, Neurons seeded on polylysine were transfected with actin-GFP alone (A, B) or cotransfected with actin-GFP and NcadΔextra (C) and observed simultaneously in bright field (left) and fluorescence (right). At time 0, 4 μm microspheres coated with 0.3 μg/cm2 Ncad-Fc were placed on growth cones with optical tweezers, then either left alone (A) or immediately restrained with a glass microneedle (B, C). Trajectories of 10 min appear in red and beads are shown 2 min after positioning. Unrestrained microspheres move rearward (A), whereas restrained beads are pulled by the experimenter in the direction of growth cone motion (from bottom to top in B, C). A punctual accumulation of actin-GFP was observed at the locus of force application for restrained beads (arrow), which was absent in control conditions, i.e., unrestrained beads (A) or cells expressing of NcadΔextra (C). D, An enrichment factor was defined as the fluorescence signal at the bead contact divided by that in a control area on the same growth cone and plotted versus time. Error bars indicate SEM. *p < 0.05.
Figure 9.
Figure 9.
Adhesiveness of N-cadherin mutants. Neurons cultured on polylysine were transfected at 1 DIV for each of the five plasmids: GFP, NcadWT-GFP, NcadΔextra, NcadΔβcat-GFP, or NcadAAA-YFP. At 2 DIV, neurons were incubated for 30 min with 2 μm microspheres coated with 0.3 μg/cm2 Ncad-Fc, and nonadherent beads were rinsed away. A, B, Representative DIC images (A) and corresponding fluorescence images (B) are presented for each condition. GFP-tagged proteins were detected using anti-GFP immunostaining in permeabilized conditions. NcadΔextra was detected with a monoclonal antibody against an N-cadherin intracellular epitope. Beads are bright because the secondary anti-mouse antibody recognizes mouse Fc-Ncad on the bead surface. C, The number of adherent beads per cell is normalized versus the control GFP condition. The fraction of beads staying on growth cones after a 2 s contact duration by optical tweezers is also plotted for each transfection (light gray bars). This is a probability that does not allow the calculation of an error bar. D, Neurite length versus N-cadherin adhesiveness for Ncad-Fc dilutions (white circles), other ligands and perturbation conditions (gray circles), and mutant receptors (black circles). The number of adherent beads per cell in the sedimentation assay was normalized versus the 0.3 μg/cm2 Ncad-Fc or GFP conditions, respectively. The line indicates a linear fit through all the data. Note that the correlation parameter is much weaker than with the coupling index (Figs. 2H, 5D). Error bars indicate SEM. *p < 0.05.
Figure 10.
Figure 10.
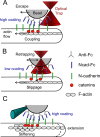
Summary diagram of the main findings. A, At a high Ncad-Fc coating density on the microsphere, corresponding to a highly adhesive substrate, there are many ligand-receptor-actin bonds formed, resulting in strong coupling to the retrograde flow and bead escape from optical tweezers. This mimics a compliant substrate that would not offer enough resistance to cell traction. B, At lower Ncad-Fc density corresponding to a weakly adhesive substrate, there are only a few ligand–receptor bonds formed, not enough to stably connect the bead to the actin retrograde flow. Occasionally, a ligand–receptor–actin linkage is formed, and the bead starts to move rearward, but the rupture of an individual bond at the catenin level at pN forces causes the bead to snap back into the optical trap. C, At a high Ncad-Fc coating density, the bead is restrained from moving rearward with a rigid microneedle, mimicking a stiff substrate. This induces local actin accumulation at the bead, which stiffens the contact and allows the growth cone to grasp the substrate and move forward.

Similar articles

Cited by

References

    1. Bekirov IH, Nagy V, Svoronos A, Huntley GW, Benson DL. Cadherin-8 and N-cadherin differentially regulate presynaptic and postsynaptic development of the hippocampal mossy fiber pathway. Hippocampus. 2007;18:349–363. - PMC - PubMed
    1. Benson DL, Tanaka H. N-cadherin redistribution during synaptogenesis in hippocampal neurons. J Neurosci. 1998;18:6892–6904. - PMC - PubMed
    1. Biederer T, Sara Y, Mozhayeva M, Atasoy D, Liu X, Kavalali ET, Sudhof TC. SynCAM, a synaptic adhesion molecule that drives synapse assembly. Science. 2002;297:1525–1531. - PubMed
    1. Boscher C, Mege RM. Cadherin-11 interacts with the FGF receptor and induces neurite outgrowth through associated downstream signalling. Cell Signal. 2008;20:1061–1072. - PubMed
    1. Bozdagi O, Shan W, Tanaka H, Benson DL, Huntley GW. Increasing numbers of synaptic puncta during late-phase LTP: N-cadherin is synthesized, recruited to synaptic sites, and required for potentiation. Neuron. 2000;28:245–259. - PubMed

Publication types