Comparative Study
. 2008 Jun 4;28(23):5965-75.
doi: 10.1523/JNEUROSCI.0060-08.2008.

Microglia cells protect neurons by direct engulfment of invading neutrophil granulocytes: a new mechanism of CNS immune privilege

Affiliations
Comparative Study

Microglia cells protect neurons by direct engulfment of invading neutrophil granulocytes: a new mechanism of CNS immune privilege

Jens Neumann et al. J Neurosci. .

Abstract

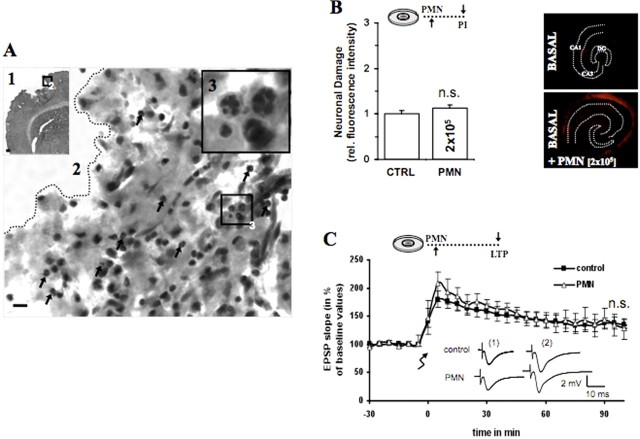
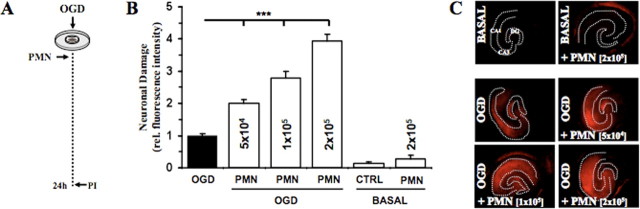
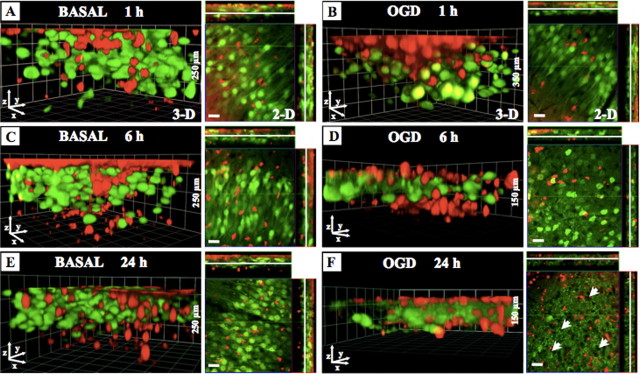
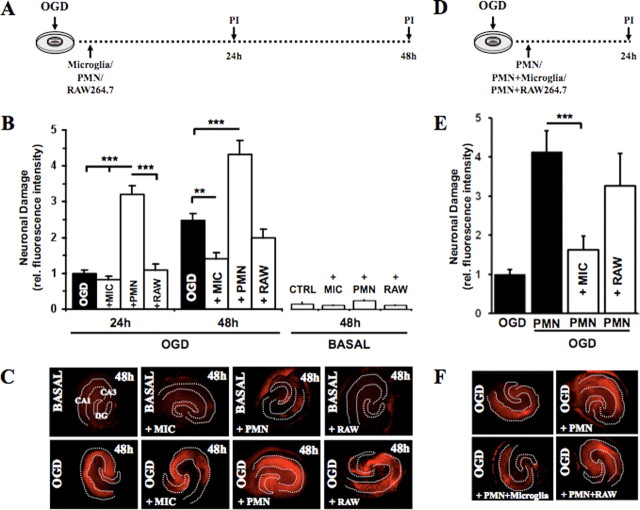
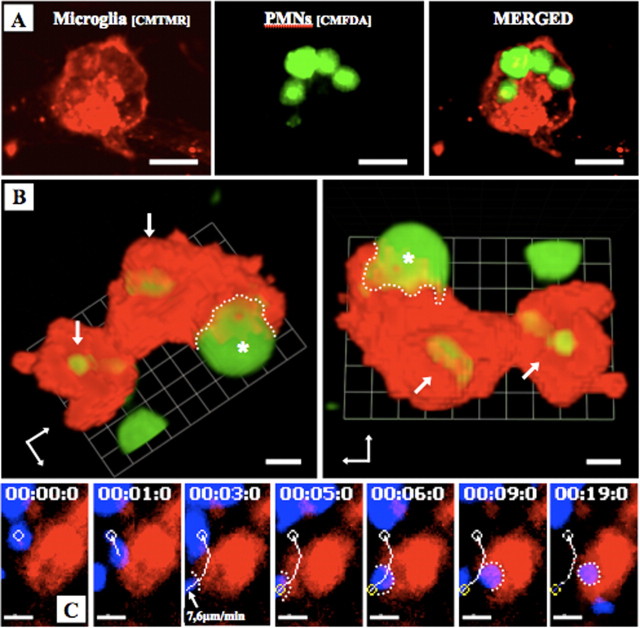
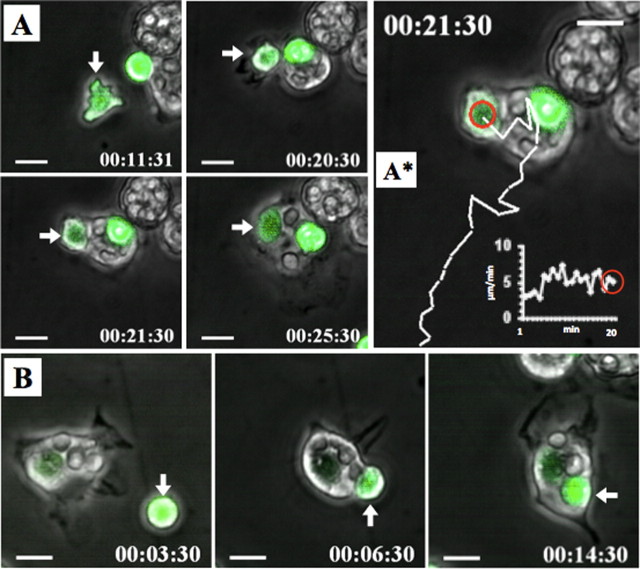
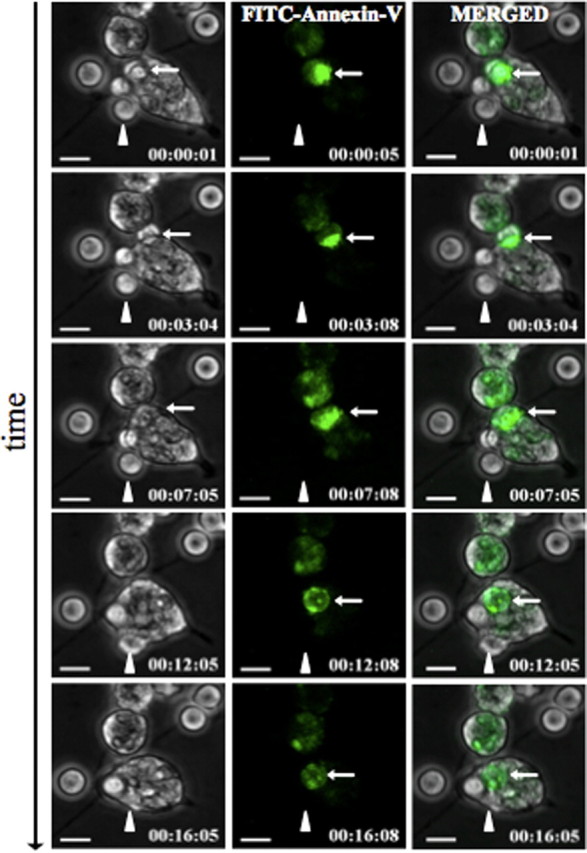
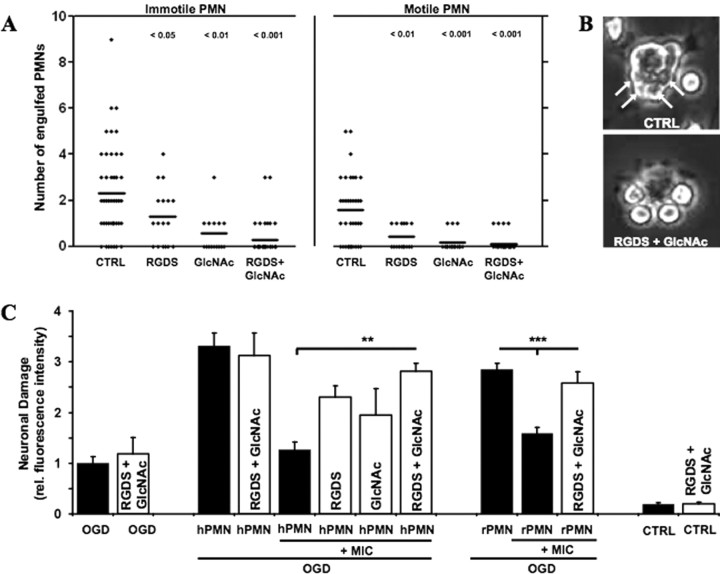
Microglial cells maintain the immunological integrity of the healthy brain and can exert protection from traumatic injury. During ischemic tissue damage such as stroke, peripheral immune cells acutely infiltrate the brain and may exacerbate neurodegeneration. Whether and how microglia can protect from this insult is unknown. Polymorphonuclear neutrophils (PMNs) are a prominent immunologic infiltrate of ischemic lesions in vivo. Here, we show in organotypic brain slices that externally applied invading PMNs massively enhance ischemic neurotoxicity. This, however, is counteracted by additional application of microglia. Time-lapse imaging shows that microglia exert protection by rapid engulfment of apoptotic, but, strikingly, also viable, motile PMNs in cell culture and within brain slices. PMN engulfment is mediated by integrin- and lectin-based recognition. Interference with this process using RGDS peptides and N-acetyl-glucosamine blocks engulfment of PMNs and completely abrogates the neuroprotective function of microglia. Thus, engulfment of invading PMNs by microglia may represent an entirely new mechanism of CNS immune privilege.


Figures

Figure 1.
Figure 1.
PMNs infiltrate the brain parenchyma 1 d after in vivo focal ischemia. A1, Hematoxylin/eosin staining of a coronal section shows an ischemic lesion in the cortex 1 d after focal ischemia. A2, Higher magnification from the edge of the ischemic lesion shows polymorphonuclear cells pointed by black arrows. A3, The black box in A2 is enlarged in A3 and demonstrates the occurrence of PMNs shown by the polymorph nucleus. Scale bar: A1, 200 μm; A2, 20 μm; A3, 10 μm. B, A total of 2 × 10⁵ PMNs was applied in 1 μl onto untreated OHCs. Quantification of neuronal death in CA1–3 was determined by PI incorporation after 24 h [control (CTRL) vs PMNs, nonsignificant (n.s.); n = 9/bar]. In the panel next to the bar chart are representative PI fluorescent images showing neuronal death in CA1–3 after 24 h. C, Because of the nearly twice greater surface of 25-d-old slices, we applied 4 × 10⁵ PMNs in 2 μl onto 1 DIV slices. The recording shows that applied PMNs did not influence EPSP signal nor the amount and persistence of LTP (CTRL vs PMNs, n.s.; CTRL = 11; PMNs, n = 6). Analogous traces represent typical recordings of single experiments taken 10 min before tetanization and 60 min after tetanization. Error bars indicate SEM.
Figure 2.
Figure 2.
Polymorphonuclear granulocytes (PMNs) exacerbate neuronal damage after OGD. A, Different numbers of PMNs (0.5 × 10⁵, 1 × 10⁵, 2 × 10⁵) were applied onto OHCs after OGD. B, Quantification of neuronal death in CA1–3 was determined by PI incorporation after 24 h (***p < 0.001 vs OGD; n = 7/bar). Error bars indicate SEM. CTRL, Control. C, Representative PI fluorescent images showing neuronal death in CA1–3 after 24 h.
Figure 3.
Figure 3.
The migration of PMNs into the OHCs under basal and OGD conditions. PMNs (1 × 10⁵) were labeled with CMTMR (red) and then directly applied onto OHCs prepared from B6.Cg-TgN(Thy1-YFP)16Jrs mice (neurons: green). At indicated time points (basal, 1, 6, 24 h; OGD, 1, 6, 24 h), slices were fixed with 4% PFA and subsequently Z-stacks through the whole OHCs were performed by using two-photon microscopy. A–F, Images show three-dimensional reconstruction of the OHCs and the representative focal plane (middle of OHCs) in the CA1 neuronal layer at the indicated time points after PMN application under basal conditions (A, C, E) or after OGD (B, D, F). Scale bars, 20 μm.
Figure 4.
Figure 4.
Exogenous microglia counteract PMN neurotoxicity. In A–C, the effects of PMNs, microglia, and macrophages (RAW264.7) were examined individually. A, PMNs (1 × 10⁵), microglia (0.8 × 10⁵), and macrophages (0.8 × 10⁵) were applied directly onto the OHCs after OGD. B, Quantification of neuronal death in CA1–3 was determined by PI incorporation after 24 and 48 h (24 h: ***p < 0.01 vs PMNs; 48 h: ***p < 0.001 PMNs vs OGD, **p < 0.01 MIC vs OGD; n = 9/bar). C, Representative PI fluorescent images showing neuronal death in CA1–3 48 h after OGD. In D–F, the effect of combined application of PMNs/microglia or PMNs/RAW264.7 was studied. D, PMNs were applied directly onto the OHCs together with microglia or macrophages after OGD. E, Quantification of neuronal death in CA1–3 was determined by PI incorporation after 24 h (***p < 0.001 PMNs vs PMNs/MIC; n = 9/bar). Error bars indicate SEM. F, Representative PI fluorescent images showing neuronal death in CA1–3 24 h after OGD. MIC, Microglia; RAW, RAW264.7.
Figure 5.
Figure 5.
Microglia phagocytose PMNs within the OHCs. PMNs (1 × 10⁵) were labeled with CMFDA (green) (A, B) or CMAC (blue) (C) and microglia with CMTMR (red) and then directly applied onto OHCs. A, OHC was fixed with 4% PFA and subsequently investigated using confocal microscopy. B, The images from a living slice show the three-dimensional reconstruction of one microglia that had already phagocytosed two PMNs (arrows) and was in progress to phagocytose another PMN (asterisk). The dotted line indicates the contact between microglia and PMNs. C, Time-lapse video microscopy was performed 4 h after experimental onset. Images show the engulfing of a motile PMN by the microglia. The white line indicates the migration pathway of the PMN. The microglia contacted the PMN at the time (3 min after start of time-lapse imaging) at which the PMN showed a velocity of 7.6 μm/min. The white dotted line shows the contact point between microglia and PMN (supplemental movie 1, available at www.jneurosci.org as supplemental material). Scale bars: A, 20 μm; B, 5 μm; C, 10 μm.
Figure 6.
Figure 6.
Microglia engulf motile PMNs. The panels show CMFDA (green)-labeled PMNs (3 × 10⁵) cocultured with primary microglia (0.75 × 10⁵). Cell movements were recorded by time-lapse microscopy. A, The panel displays a microglia that engulfed a motile CMFDA-labeled PMN (arrow). A*, The image depicts the PMN migration path (white line) before the microglia contacted and engulfed the PMN (red circle). The integrated white graph shows the PMN velocity of 5 μm/min at the time the microglia had touched the PMN (supplemental movie 2, available at www.jneurosci.org as supplemental material). B, Images show the engulfment of an immotile CMFDA-labeled PMN (arrow) (supplemental movie 4, available at www.jneurosci.org as supplemental material). Scale bars, 10 μm.
Figure 7.
Figure 7.
Microglia engulf preapoptotic and nonapoptotic PMNs. FITC-conjugated Annexin V was added to the microglia–PMN coculture, and thus proapoptotic cells were visualized by an increased FITC signal. The white thin arrow points on an Annexin V-positive PMN that was fully engulfed after 12 min. The arrowhead shows a PMN that was engulfed without exhibiting a FITC signal at any time point of the engulfment process (supplemental movie 5, available at www.jneurosci.org as supplemental material). Scale bars, 10 μm.
Figure 8.
Figure 8.
Blockage of the engulfment process of PMNs by microglia worsens the outcome of neuronal viability after OGD. A, Microglia were preincubated with RGDS (1 mm) or GlcNAc (20 mm) or both for 20 min before PMNs were added to the microglia. Time-lapse microscopy was performed to distinguish the engulfment of immotile and motile PMNs by the microglia. Column scatterplots show the number of PMNs engulfed by microglia under the indicated conditions. Significance values are shown above the columns. B, The images show representative microglia that were exposed to PMNs. The arrows on the top image display the engulfed PMN within the microglia. The bottom image shows PMNs that adhere to the microglia without being internalized. C, Microglia were preincubated with RGDS (1 mm) and GlcNAc (20 mm) or both for 20 min before they were applied together with either human-derived (hPMN) or rat-derived (rPMN) PMN onto OGD-treated OHCs. Quantification of neuronal death in CA1–3 was determined by PI incorporation after 24 h [**p < 0.01, hPMN plus MIC (OGD) vs hPMN plus MIC plus RGDS/GlcNAc (OGD); ***p < 0.001, rPMN plus MIC (OGC) vs rPMN plus MIC plus RGDS/GlcNAc (OGD); n = 5–7/bar]. Error bars indicate SEM. CTRL, Control; MIC, microglia.

References

    1. Arai H, Furuya T, Yasuda T, Miura M, Mizuno Y, Mochizuki H. Neurotoxic effects of lipopolysaccharide on nigral dopaminergic neurons are mediated by microglial activation, interleukin-1beta, and expression of caspase-11 in mice. J Biol Chem. 2004;279:51647–51653. - PubMed
    1. Arumugam TV, Granger DN, Mattson MP. Stroke and T-cells. Neuromol Med. 2005;7:229–242. - PubMed
    1. Baldauf K, Reymann KG. Influence of EGF/bFGF treatment on proliferation, early neurogenesis and infarct volume after transient focal ischemia. Brain Res. 2005;1056:158–167. - PubMed
    1. Banati RB, Graeber MB. Surveillance, intervention and cytotoxicity: is there a protective role of microglia? Dev Neurosci. 1994;16:114–127. - PubMed
    1. Barone FC, Hillegass LM, Price WJ, White RF, Lee EV, Feuerstein GZ, Sarau HM, Clark RK, Griswold DE. Polymorphonuclear leukocyte infiltration into cerebral focal ischemic tissue: myeloperoxidase activity assay and histologic verification. J Neurosci Res. 1991;29:336–345. - PubMed

Publication types

LinkOut - more resources