Comparative Study
. 2008 Jun 4;28(23):6022-9.
doi: 10.1523/JNEUROSCI.0080-08.2008.

Epidural stimulation induced modulation of spinal locomotor networks in adult spinal rats

Affiliations
Comparative Study

Epidural stimulation induced modulation of spinal locomotor networks in adult spinal rats

Igor Lavrov et al. J Neurosci. .

Abstract

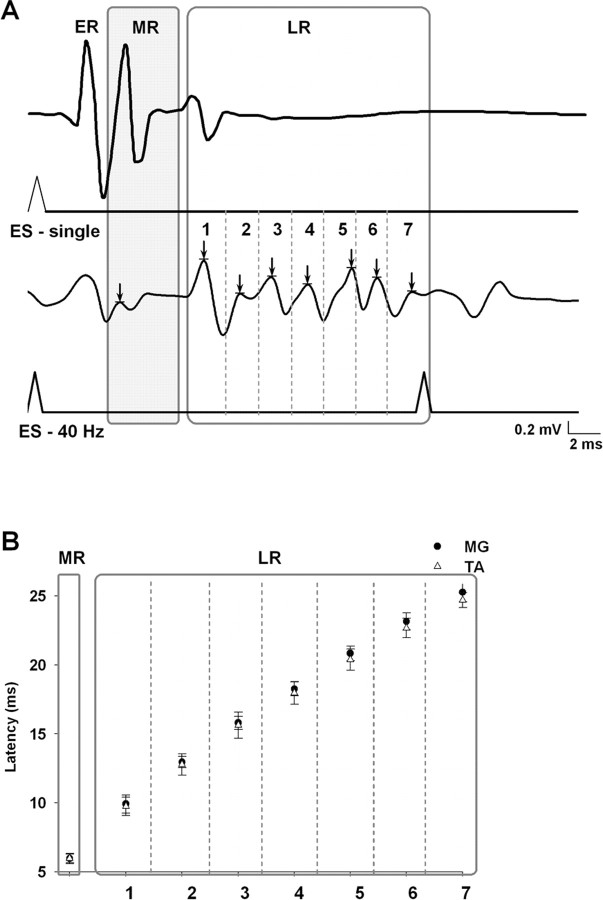
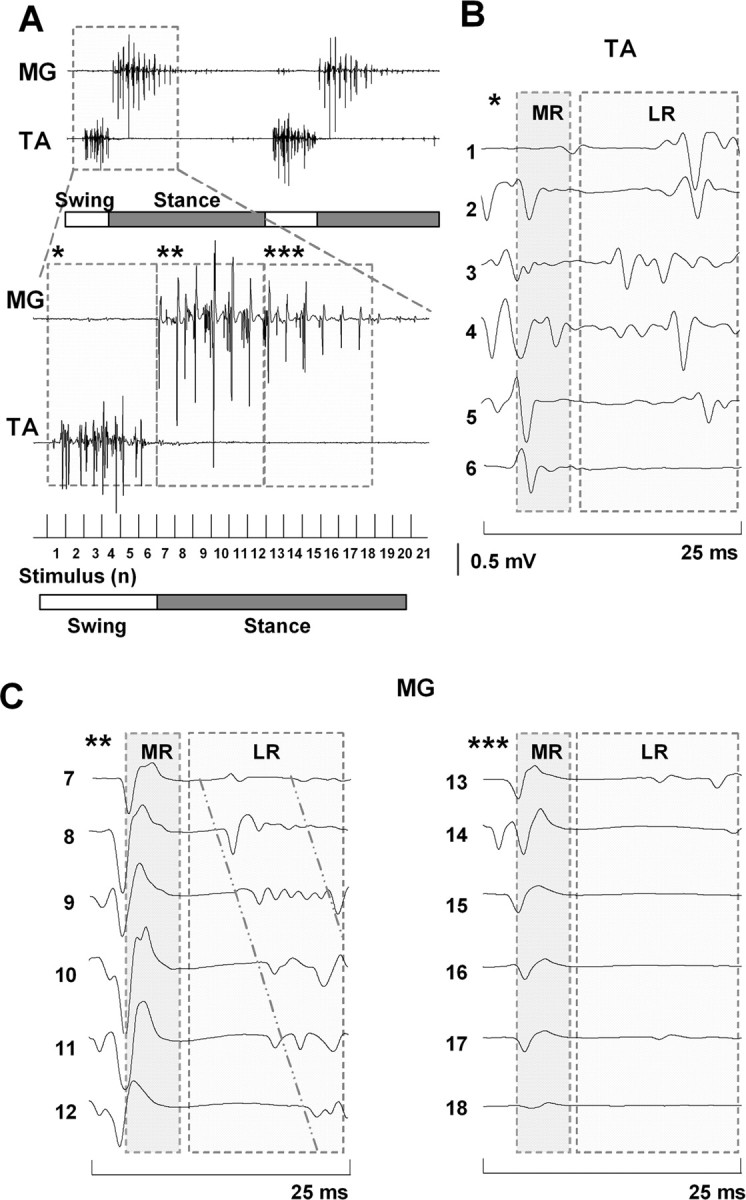
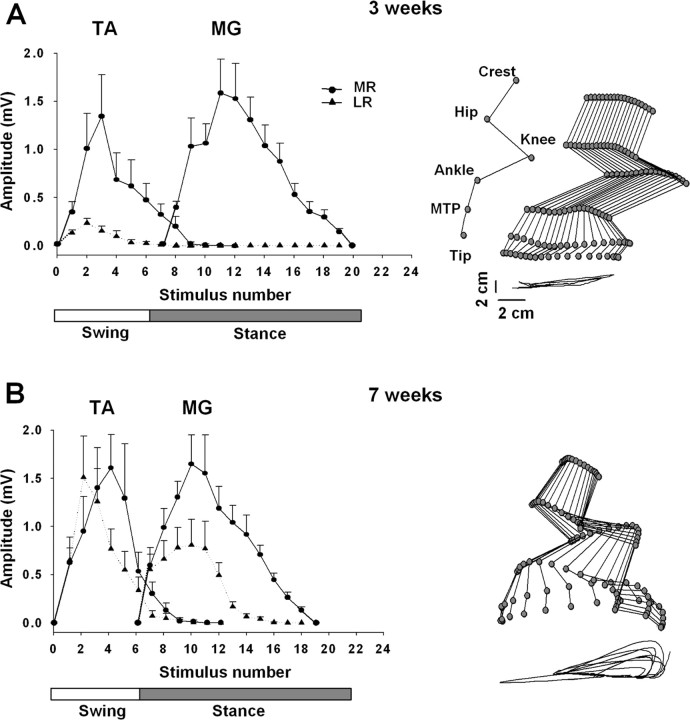
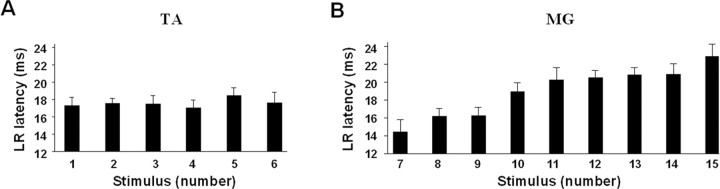
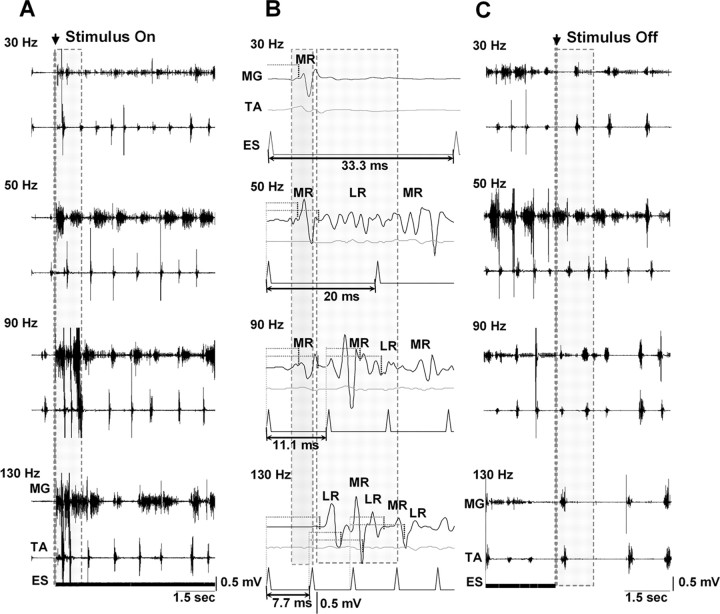
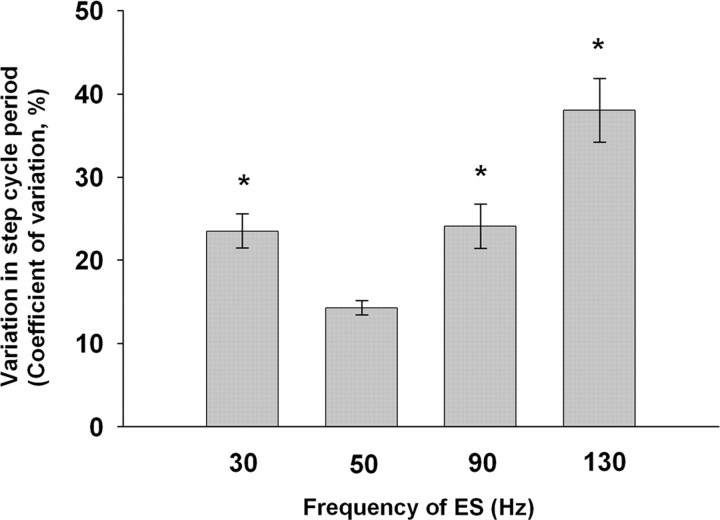
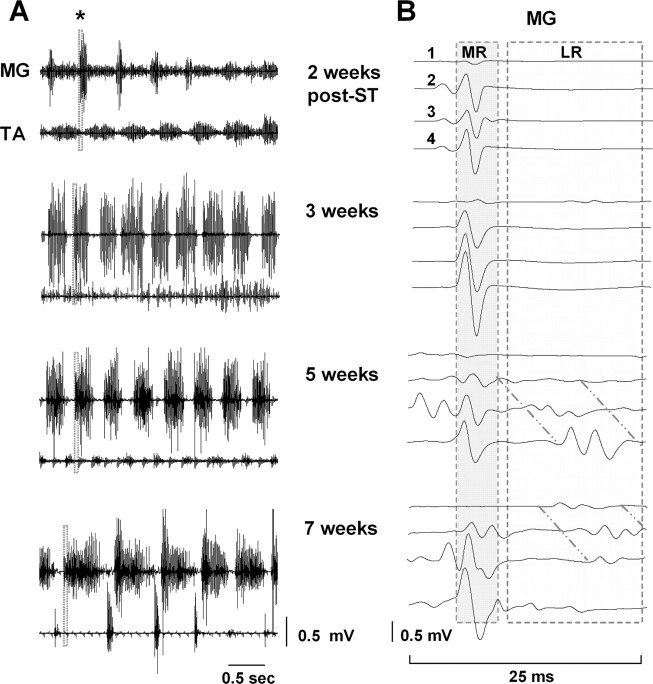
The importance of the in vivo dynamic nature of the circuitries within the spinal cord that generate locomotion is becoming increasingly evident. We examined the characteristics of hindlimb EMG activity evoked in response to epidural stimulation at the S1 spinal cord segment in complete midthoracic spinal cord-transected rats at different stages of postlesion recovery. A progressive and phase-dependent modulation of monosynaptic (middle) and long-latency (late) stimulation-evoked EMG responses was observed throughout the step cycle. During the first 3 weeks after injury, the amplitude of the middle response was potentiated during the EMG bursts, whereas after 4 weeks, both the middle and late responses were phase-dependently modulated. The middle- and late-response magnitudes were closely linked to the amplitude and duration of the EMG bursts during locomotion facilitated by epidural stimulation. The optimum stimulation frequency that maintained consistent activity of the long-latency responses ranged from 40 to 60 Hz, whereas the short-latency responses were consistent from 5 to 130 Hz. These data demonstrate that both middle and late evoked potentials within a motor pool are strictly gated during in vivo bipedal stepping as a function of the general excitability of the motor pool and, thus, as a function of the phase of the step cycle. These data demonstrate that spinal cord epidural stimulation can facilitate locomotion in a time-dependent manner after lesion. The long-latency responses to epidural stimulation are correlated with the recovery of weight-bearing bipedal locomotion and may reflect activation of interneuronal central pattern-generating circuits.


Figures

Figure 1.
Figure 1.
A, Example of spinal cord motor evoked responses to ES at S1 in the MG muscle in a spinal cord-transected rat during standing [single shock (ES-single); top traces] compared with stepping [40 Hz stimulation (ES-40 Hz); bottom traces] on a treadmill at 7 cm/s. The potentials marked as ER (early response) have been shown to be directly evoked potentials that become prominent at higher stimulation voltages, such as that used for the single shock during standing (Lavrov et al., 2006; Gerasimenko et al., 2007). The potentials marked as MR (middle response) have the characteristics of a monosynaptic response. The potentials marked as LR (late response) show one peak in response to a single shock and a sequence of peaks (labeled 1–7) during 40 Hz stimulation. B, Latency of the MR and LR in the MG and TA muscles during stepping on a treadmill. The number of peaks (1–7; arrows) in the LR in A corresponds to the latency for each peak of the LR in B. The arrow in the shaded region marks the MR response. The mean latency of each time bin was significantly greater than the previous time bin. These delays were not significantly different between the TA and MG. The means ± SEM for each of the seven time bins were derived from evoked potentials of 10 bursts from nine rats.
Figure 2.
Figure 2.
A, Formation of EMG bursts in the MG and TA muscles from the MR and LR during epidural stimulation-induced (40 Hz) stepping in a spinal rat. B, C, Induction of a series of MRs and LRs in the TA and MG muscles, respectively, during one step cycle. Asterisks in B and C correspond to the interval noted with the same number of asterisks in A. Horizontal bars: open, swing phase; filled, stance phase of a step cycle. The diagonal lines in C highlight the shift in the latency of the LR in the MG with consecutive stimuli. Abbreviations are the same as in Figure 1.
Figure 3.
Figure 3.
A, B, Modulation of the MR and LR during stepping on a treadmill at 7 cm/s facilitated by ES at S1 (40 Hz) at 3 and 7 weeks after spinal cord transection, respectively. Values are mean ± SEM for nine rats. Note the substantial recovery of the LR at 7 weeks compared with 3 weeks after spinal cord transection. Representative stick diagrams of the hindlimb movements during the swing phase at 3 and 7 weeks after spinal cord transection are shown on the right. The time between individual sticks is 30 ms. The trajectories of the ankle for seven consecutive steps are shown at the bottom of each stick figure. Joint angles are identified in A. Abbreviations are the same as in Figure 1.
Figure 4.
Figure 4.
A, B, Mean ± SEM latencies of the maximal LR for the TA and MG muscles for the spinal rats shown in Figure 2. The numbers on the abscissas (1–15) correspond to the sequence of stimuli in one step cycle as shown in Figure 2A. The latencies of the LR for a sequence of six stimuli during the TA burst remained relatively constant, whereas the latencies for a series of similar responses in the MG increased progressively. Abbreviations are the same as in Figure 1.
Figure 5.
Figure 5.
A, Effect of different frequencies of ES on the initiation of stepping in spinal rats. Shaded areas in A represent the initial period after the onset of ES: note the transitional phase involving disorganized, high-amplitude activity at the higher (90 and 130 Hz), but not the lower (30 and 50 Hz), stimulation frequencies. The most consistent bursting pattern is seen at 50 Hz. B, Note the different modulation of the MR and LR at different frequencies of stimulation. The first shaded area shows the MR from the first stimulus. The most consistent stepping at 50 Hz in A corresponds to the appearance of an LR between the MRs of the first and second stimuli (second shaded area). At higher frequencies, the MRs of subsequent stimuli overlap the LRs. The horizontal dotted lines identify the latencies for the MR and LR. C, Comparisons of the bursting patterns at different frequencies when the epidural stimulation is terminated. Note that the most robust bursting and alternating pattern immediately after the stimulus is turned off is observed at 50 Hz (shaded area). Abbreviations are the same as in Figure 1.
Figure 6.
Figure 6.
Variability in the step cycle period at different frequencies of ES. The mean ± SEM variability was significantly higher at all other frequencies than at 50 Hz (n = 6 rats; *p < 0.001, Kruskal–Wallis rank test).
Figure 7.
Figure 7.
A, EMG bursting patterns for the MG and TA of a representative spinal rat during treadmill stepping at 7 cm/s facilitated by ES at S1 (40 Hz) 2, 3, 5, and 7 weeks after spinal cord transection. B, MR and LR in the MG during four consecutive stimuli at the same points as in A. The shaded areas (25 ms) in the EMG recordings at each time point in A are expanded in B. Note the absence of an LR at 2 and 3 weeks and the reappearance at 5 weeks after spinal cord transection. Note also the increasing delay in the LR with consecutive stimuli highlighted by diagonal lines in B. Abbreviations are the same as in Figure 1.

References

    1. Barbeau H, Rossignol S. Initiation and modulation of the locomotor pattern in the adult chronic spinal cat by noradrenergic, serotonergic and dopaminergic drugs. Brain Res. 1991;546:250–260. - PubMed
    1. Barthélemy D, Leblond H, Rossignol S. Characteristics and mechanisms of locomotion induced by intraspinal microstimulation and dorsal root stimulation in spinal cats. J Neurophysiol. 2007;97:1986–2000. - PubMed
    1. Burke RE, Degtyarenko AM, Simon ES. Patterns of locomotor drive to motoneurons and last-order interneurons: clues to the structure of the CPG. J Neurophysiol. 2001;86:447–462. - PubMed
    1. Chau C, Barbeau H, Rossignol S. Effects of intrathecal alpha1- and alpha2-noradrenergic agonists and norepinephrine on locomotion in chronic spinal cats. J Neurophysiol. 1998;79:2941–2963. - PubMed
    1. Chiba A, Oshio K, Inase M. Magnetically evoked EMGs in rats. Neurol Res. 2003;25:87–91. - PubMed

Publication types