. 2008 Aug;100(2):888-906.
doi: 10.1152/jn.00884.2007. Epub 2008 Jun 4.

Neural response properties of primary, rostral, and rostrotemporal core fields in the auditory cortex of marmoset monkeys

Affiliations

Neural response properties of primary, rostral, and rostrotemporal core fields in the auditory cortex of marmoset monkeys

Daniel Bendor et al. J Neurophysiol. 2008 Aug.

Abstract

The core region of primate auditory cortex contains a primary and two primary-like fields (AI, primary auditory cortex; R, rostral field; RT, rostrotemporal field). Although it is reasonable to assume that multiple core fields provide an advantage for auditory processing over a single primary field, the differential roles these fields play and whether they form a functional pathway collectively such as for the processing of spectral or temporal information are unknown. In this report we compare the response properties of neurons in the three core fields to pure tones and sinusoidally amplitude modulated tones in awake marmoset monkeys (Callithrix jacchus). The main observations are as follows. (1) All three fields are responsive to spectrally narrowband sounds and are tonotopically organized. (2) Field AI responds more strongly to pure tones than fields R and RT. (3) Field RT neurons have lower best sound levels than those of neurons in fields AI and R. In addition, rate-level functions in field RT are more commonly nonmonotonic than in fields AI and R. (4) Neurons in fields RT and R have longer minimum latencies than those of field AI neurons. (5) Fields RT and R have poorer stimulus synchronization than that of field AI to amplitude-modulated tones. (6) Between the three core fields the more rostral regions (R and RT) have narrower firing-rate-based modulation transfer functions than that of AI. This effect was seen only for the nonsynchronized neurons. Synchronized neurons showed no such trend.


Figures

FIG. 1.
FIG. 1.
Model of the organization of auditory cortex in marmosets. A: location of auditory cortex within a marmoset's left hemisphere. B: the organization of auditory fields within auditory cortex. The lateral sulcus is unfolded to show the portion of auditory cortex found within the lateral sulcus (adapted from Pistorio et al. 2005). The relative sizes and locations of each field were estimated from physiological and anatomical data, in combination with data from previous studies (Burman et al. 2006; Kaas and Hackett 2000). A 1-mm-scale bar is displayed. LS, lateral sulcus; S2, secondary somatosensory area; PV, parietal ventral area; Ins, insula; AI, primary auditory cortex; R, rostral field; RT, rostral temporal field; STS, superior temporal sulcus; M, medial; R, rostral; C, caudal; L, lateral; V1, primary visual cortex; M1, primary motor cortex; S1, primary somatosensory cortex; MT, middle temporal area.
FIG. 2.
FIG. 2.
Cortical best-frequency maps. Two maps of the spatial distribution of BFs, and the borders of AI/R and R/RT (dashed lines) based on the methods shown in Fig. 3. Pure-tone–responsive and pure-tone–nonresponsive recording sites are indicated on the plot. A 1-mm-scale bar is shown on each BF map. BF, best frequency; M, medial; R, rostral; C, caudal; L, lateral. A: subject 1: M2P (left hemisphere). B: subject 2: M32Q (left hemisphere).
FIG. 3.
FIG. 3.
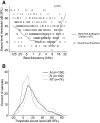
Calculation of core area boundaries. Best frequency of units according to their location along the caudal-to-rostral axis (parallel to lateral sulcus). The median best frequency (gray line) calculated using a sliding window (see methods) is plotted on the data. A: data from M2P (left hemisphere). B: data from M32Q (left hemisphere). C: BF distributions for neurons in AI, R, and RT.
FIG. 4.
FIG. 4.
Examples of neuronal responses to pure tones in fields R and RT. Subject, unit number, and sound level of acoustic stimulus are indicated on each plot. The stimulus is presented during the shaded portion of the plot (E: 0–500 ms; all others: 0–200 ms). AC: field R neurons. DI: field RT neurons.
FIG. 5.
FIG. 5.
Average spontaneous and peak discharge rate. Comparison of spontaneous discharge rates and peak discharge rates in AI, R, and RT. Distribution of spontaneous rates is shown in the top plot. The distribution of peak discharge rates is shown on the right plot. The spontaneous rate has not been subtracted from the peak rate in this analysis. Two AI units and one R unit have peak discharge rates >150 spikes/s, and are not displayed. Only neurons tested with tone durations ≥200 ms are analyzed here. The black dashed diagonal line has slope = 1.
FIG. 6.
FIG. 6.
Distribution of sound level threshold. A: sound level threshold across all neurons (2 subjects) with significant discharge rates. Marmoset audiogram (data from Seiden 1957) shown in gray. B: distribution of sound level threshold in AI, R, and RT. Only neurons with BFs between 1 and 16 kHz were used to avoid biases resulting from differences between areas in their frequency map.
FIG. 7.
FIG. 7.
Distribution of best sound level and monotonicity index. A: best sound level across all neurons (2 subjects) with significant discharge rates. Marmoset audiogram (data from Seiden 1957) shown in gray. B: distribution of best sound levels in AI, R, and RT. Only neurons with BFs between 1 and 16 kHz were used to avoid biases resulting from differences between areas in their frequency map. C: distribution of the monotonicity index in AI, R, and RT.
FIG. 8.
FIG. 8.
Spectral bandwidth comparison (Q10 and BW10) between fields AI, R, and RT. A: distribution of Q10 values in AI, R, and RT. B: comparison of BF and Q10 values. Solid/dashed lines indicate the median Q10 values within a 1-octave BF range. C: distribution of BW10 values in AI, R, and RT. D: comparison of BF and BW10 values. Solid/dashed lines indicate the median BW10 values within a 1-octave BF range. One AI neuron with a BW10 value >2.5 is not shown in this plot.
FIG. 9.
FIG. 9.
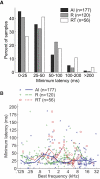
Minimum response latencies in the 3 core fields. A: distribution of minimum pure-tone–response latencies of neurons in AI, R, and RT. B: minimum response latency and BF of individual neurons. Five neurons [AI (2), R(1), RT (2)] are not shown on the plot because their minimum latency is >200 ms. Solid/dashed lines plot median minimum latency within a 1-octave BF range.
FIG. 10.
FIG. 10.
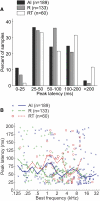
Peak response latencies in the 3 core fields. A: distribution of peak pure-tone–response latencies of neurons in AI, R, and RT. B: peak latency of individual neurons compared with BF. Fifteen neurons [AI (6), R(2), RT (7)] are not shown on the plot because their peak latency is >200 ms. Solid/dashed lines plot median peak latency within a 1-octave BF range.
FIG. 11.
FIG. 11.
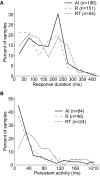
Response duration and persistent activity. A: distribution of response duration in AI, R, and RT. B: distribution of persistent activity in AI, R, and RT.
FIG. 12.
FIG. 12.
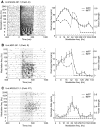
Individual neuron responses to sinusoidally amplitude modulated (sAM) tones. Raster plots (left) and firing-rate–based modulation transfer function (rMTF)/temporal modulation transfer function (tMTF) plots (right) for 3 neurons. The stimulus is presented during the shaded portion of the raster plot (0–500 ms). The horizontal dashed line in the rMTF/tMTF plot indicates the criteria for a significant firing rate (see methods). The error bars in the rMTF plot indicate the SE. A: synchronized unit example from AI (Unit M32Q-287.1). B: synchronized unit example from R (Unit M2P-301.1). C: nonsynchronized unit example from RT (Unit M32Q-211.1).
FIG. 13.
FIG. 13.
Population discharge patterns to sAM tones. Average PSTHs for a 4-, 16-, 32-, and 128-Hz modulation frequency as well as the modulation frequency evoking the peak response (rate-based best modulation frequency [rBMF]), shown for the AI (A), R (B), and RT (C) populations. The sAM tone is played from 0 to 500 ms on the plot (indicated by the solid bar).
FIG. 14.
FIG. 14.
Temporal response properties of neurons in AI, R, and RT. A: percentage of samples with stimulus locked discharges in AI, R, and RT. B: average vector strength of AI, R, and RT populations. Average vector strengths significantly different from zero (Wilcoxon rank-sum test, Bonferroni corrected, P < 0.05) are indicated. C: distribution of temporal best modulation frequencies (tBMFs) in AI, R, and RT. D: distribution of the stimulus synchronization limit (fmax) in AI, R, and RT.
FIG. 15.
FIG. 15.
Firing rate response properties of neurons in AI, R, and RT to sAM tones. A: distribution of rBMFs in AI, R, and RT. B: normalized responses of AI, R, and RT population to a sAM tone's modulation frequency (normalized by the rBMF). Synchronized population (dashed), nonsynchronized population (solid). C: half-maximum bandwidth of rMTFs for AI, R, and RT nonsynchronized populations. D: half-maximum bandwidth of rMTFs for AI, R, and RT synchronized populations. E: full bandwidth of rMTFs for AI, R, and RT nonsynchronized populations. F: full bandwidth of rMTFs for AI, R, and RT synchronized populations.
FIG. 16.
FIG. 16.
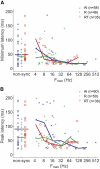
Comparison of response latency with stimulus synchronization limit (fmax). Median values are indicated by the plotted line. A: minimum latency vs. stimulus synchronization limit (fmax): 2 AI nonsync and 2 RT nonsync units not shown in the plot have minimum latencies >200 ms. B: peak latency vs. stimulus synchronization limit (fmax): 4 AI nonsync, 1 R sync, and 5 RT nonsync units not shown in the plot have peak latencies >200 ms.
FIG. 17.
FIG. 17.
Proposed model of spectral and temporal processing pathways in primate auditory cortex. In the proposed model, the temporal processing pathway is in the caudal-to-rostral axis, where AI has the smallest temporal integration window and this temporal integration window increases in R and RT. The spectral processing pathway is in the medial-to-lateral axis, where AI and the other core fields have the smallest spectral integration window, and belt and parabelt areas have larger spectral integration windows. AI, primary auditory cortex; R, rostral field; RT, rostrotemporal field; ML, middle lateral field; AL, anterolateral field; RL, rostrolateral field; f, frequency, t, time.

Similar articles

Cited by

References

    1. Aitkin L, Park V. Audition and the auditory pathway of a vocal New World primate, the common marmoset. Prog Neurobiol 41: 345–367, 1993. - PubMed
    1. Aitkin LM, Kudo M, Irvine DR. Connections of the primary auditory cortex in the common marmoset, Callithrix jacchus jacchus. J Comp Neurol 8; 269: 235–248, 1988. - PubMed
    1. Aitkin LM, Merzenich MM, Irvine DR, Clarey JC, Nelson JE. Frequency representation in auditory cortex of the common marmoset (Callithrix jacchus jacchus). J Comp Neurol 252: 175–185, 1986. - PubMed
    1. Barbour DL, Wang X. Contrast tuning in auditory cortex. Science 299: 1073–1075, 2003. - PMC - PubMed
    1. Bendor D, Wang X. The neuronal representation of pitch in primate auditory cortex. Nature 436: 1161–1165, 2005. - PMC - PubMed

Publication types

LinkOut - more resources