. 2008 Jun 3;6(6):e131.
doi: 10.1371/journal.pbio.0060131.

Selective ligand recognition by a diversity-generating retroelement variable protein

Affiliations

Selective ligand recognition by a diversity-generating retroelement variable protein

Jason L Miller et al. PLoS Biol. .

Abstract

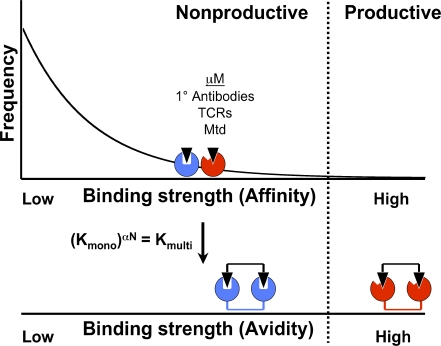
Diversity-generating retroelements (DGRs) recognize novel ligands through massive protein sequence variation, a property shared uniquely with the adaptive immune response. Little is known about how recognition is achieved by DGR variable proteins. Here, we present the structure of the Bordetella bacteriophage DGR variable protein major tropism determinant (Mtd) bound to the receptor pertactin, revealing remarkable adaptability in the static binding sites of Mtd. Despite large dissimilarities in ligand binding mode, principles underlying selective recognition were strikingly conserved between Mtd and immunoreceptors. Central to this was the differential amplification of binding strengths by avidity (i.e., multivalency), which not only relaxed the demand for optimal complementarity between Mtd and pertactin but also enhanced distinctions among binding events to provide selectivity. A quantitatively similar balance between complementarity and avidity was observed for Bordetella bacteriophage DGR as occurs in the immune system, suggesting that variable repertoires operate under a narrow set of conditions to recognize novel ligands.


Conflict of interest statement

Competing interests. JFM is a board member of and both JFM and PG have served as consultants for AvidBiotics Corp. and have received compensation for these services. Under an agreement between AvidBiotics Corp. and University of California San Diego, JLM and PG are entitled to inventors' share of licensing revenue received by the University of California San Diego from AvidBiotics Corp.

Figures

Figure 1
Figure 1. Tropism and Receptor Specificities of Bordetella Bacteriophages
(A) The Mtd-P1 variant is expressed by BPP-1 phage and sets the tropism of the phage to Bvg+ Bordetella due to recognition of the Bvg+-specific receptor pertactin. The Mtd-M1 variant is a direct descendant of Mtd-P1 and is expressed by BMP-1 phage. It sets tropism to Bvg Bordetella through recognition of an unidentified receptor. Mtd-M1 also binds pertactin, albeit nonproductively. The Mtd-P6 variant is a direct descendant of Mtd-M1 and is expressed by BPP-6 phage. It sets the tropism of BPP-6 to Bvg+ Bordetella due to recognition of pertactin. (B) Variable region sequences of Mtd-P1, Mtd-M1, and Mtd-P6. Variable residues are in color, and invariant residues in black. For Mtd-P1, variable residues are in blue. For Mtd-M1, variable residues in common with Mtd-P1 are in blue, and those unique to Mtd-M1 are in green. For Mtd-P6, residues in common with Mtd-M1 or Mtd-P1 are in green or blue, respectively, and those unique to Mtd-P6 are in red. Mtd has 381 residues in total.
Figure 2
Figure 2. Structure of Mtd-P1 Bound to Prn-E.
(A) (Top left) The Mtd-P1·Prn-E complex is depicted in molecular surface representation, with each protomer in the Mtd-P1 trimer colored a different shade of gray and Prn-E colored blue. The trimer axis of Mtd is depicted by a gray triangle at the top. One site of trimeric Mtd binds the major pertactin loop (399–407); a second site binds the minor pertactin loop (residues 190–199); the third site is empty. (Bottom left) Arrow designates a 90° rotation, which exposes the empty site to view. (Top right) Arrows designate 90° rotations (Mtd rotated back toward page, Prn-E forward toward viewer) that expose the interacting surfaces to view (green, hydrophobic contacts; red, hydrophilic contacts; yellow, hydrophobic buried; purple, hydrophilic buried). Contact residues are those having an interatomic distance between Mtd-P1 and Prn-E of ≤4 Å, and buried residues are those having an interatomic distance of >4 Å and excluding water due to association. (B) The Mtd-P1·Prn-E complex is depicted in ribbon representation (Mtd protomers in red, pink, and purple and Prn-E in blue). Prn-E loops that contact Mtd-P1 are green and labeled. The trimer axis of Mtd is depicted by a gray triangle at the top. For reference, the RGD loop of pertactin is shown in light gray in the conformation observed for B. pertussis pertactin [12] but was not modeled in the structure of the Mtd-P1·Prn-E complex.
Figure 3
Figure 3. Mtd-P1 Receptor-Binding Sites
(A) The Mtd-P1·Prn-E complex is depicted with Mtd-P1 in molecular surface representation and Prn-E in yellow stick representation. The view is looking at the base of the pyramid-shaped Mtd trimer. The surfaces of the Mtd sites that bind the major and minor pertactin loops are colored (green, hydrophobic residues; red, hydrophilic residues). (B) Contacts between Mtd-P1 and the major pertactin loop. Mtd-P1 is depicted in molecular surface representation, as in (A). Backbone atoms of the Mtd-P1 variable region are depicted in gray curvilinear representation, and side chain carbons, oxygens, and nitrogens in gray, red, and blue, respectively. Mtd-P1 residues are labeled in blue. The major loop of Prn-E (residues 399–407, sequence below panel) is depicted in stick representation (backbone in yellow and side chain carbons, oxygens, and nitrogens in yellow, red, and blue, respectively). Prn-E residues are labeled in black. The backbone carbonyls of Prn-E Pro403 and Pro405 are also depicted. (C) Contacts between Mtd-P1 and the minor pertactin loop, depicted as in (B). (D and E). Hydrogen bonds to (D) major and (E) minor pertactin loops are shown as cyan dashed lines. Atom coloring is as in panels (B) and (C).
Figure 4
Figure 4. Superposition of Mtd-P1 Variable Regions
(A) Mtd-P1 sites from the Mtd-P1·Prn-E complex that bind the major (orange) or minor (green) pertactin loops or no pertactin loop (cyan) are superposed (average root-mean-square deviation 0.303 Å for 376 Cα atoms). The backbone is shown in curvilinear representation, and side chains of variable residues, along with the invariant residues Tyr322 and Tyr333, are shown in stick representation. Variable residues are labeled in blue, and invariant ones in black. (B) The Mtd-P1 site from the Mtd-P1·Prn-E complex that binds the major pertactin loop (gray) is superimposed with a site from unbound Mtd-P1 (blue) (root-mean-square deviation 0.450 Å for 376 Cα atoms).
Figure 5
Figure 5. Dependency of Mtd Interactions on Major and Minor Pertactin Loops
(A) Coprecipitation of 60 μM (trimer concentration) Mtd-P1 (top), Mtd-M1 (middle), and Mtd-P6 with His-tagged wild-type Prn-E, Prn-EΔ399–407, Prn-EΔ190–199, or no Prn-E using Ni2+-NTA beads and visualized by SDS-PAGE and Coomassie staining. I, relative amount incubated with Ni2+-NTA beads; E, relative amount eluted from beads. (B) Quantification of binding of Mtd-P1 (blue), Mtd-M1 (green), and Mtd-P6 (red) to Prn-EΔ399–407 and Prn-EΔ190–199, normalized by binding to Prn-E. Values were corrected for background binding (no Prn-E) to Ni2+-NTA beads.
Figure 6
Figure 6. Affinity of Mtd and Avidity of Phage
The SPR sensorgrams showing association of Mtd-P1 (blue), Mtd-P6 (cyan), and Mtd-M1 (purple) and of phage BPP-1 (red), BPP-6 (pink), BIP-1 (thin green), BMP-1 (yellow), and BMP-1 10,000× (thick green) with biotinylated Prn-E immobilized on a streptavidin chip. Curves were chosen for display and represent one of six (or five in the case of BMP-1 10,000×) different concentrations.
Figure 7
Figure 7. Phage Binding to Bordetella
Binding of (A) BPP-1, (B) BPP-6, and (C) BMP-1 to Bvg+ Bordetella. For BPP-1 and BPP-6, binding to Bvg Bordetella was subtracted as nonspecific background, and for BMP-1, binding to E. coli was subtracted as nonspecific background. Phage concentrations were determined by plaquing on appropriate hosts and thus represent viable phage.
Figure 8
Figure 8. Avidity Provides Amplification and Differential Gain
(Top) Distribution of variable proteins and their individual binding strengths (monovalent affinities) to a particular ligand (triangle), with two variants depicted (red and blue). (Bottom) Avidity amplifies monovalent affinities through the exponential factor αN, resulting in some members of the repertoire crossing a threshold required for productive interaction and biological effect. Differences between monovalent affinities are also amplified such that slightly differing monovalent affinities become vastly differing multivalent avidities.

References

    1. Pancer Z, Cooper MD. The evolution of adaptive immunity. Annu Rev Immunol. 2006;24:497–518. - PubMed
    1. Davis MM, Bjorkman PJ. T-cell antigen receptor genes and T-cell recognition. Nature. 1988;334:395–402. - PubMed
    1. Alder MN, Rogozin IB, Iyer LM, Glazko GV, Cooper MD, et al. Diversity and function of adaptive immune receptors in a jawless vertebrate. Science. 2005;310:1970–1973. - PubMed
    1. Liu M, Deora R, Doulatov SR, Gingery M, Eiserling FA, et al. Reverse transcriptase-mediated tropism switching in Bordetella bacteriophage. Science. 2002;295:2091–2094. - PubMed
    1. Doulatov S, Hodes A, Dai L, Mandhana N, Liu M, et al. Tropism switching in Bordetella bacteriophage defines a family of diversity-generating retroelements. Nature. 2004;431:476–481. - PubMed

Publication types