. 2008 Jun 3;6(6):e135.
doi: 10.1371/journal.pbio.0060135.

The evolution of the DLK1-DIO3 imprinted domain in mammals

Affiliations

The evolution of the DLK1-DIO3 imprinted domain in mammals

Carol A Edwards et al. PLoS Biol. .

Abstract

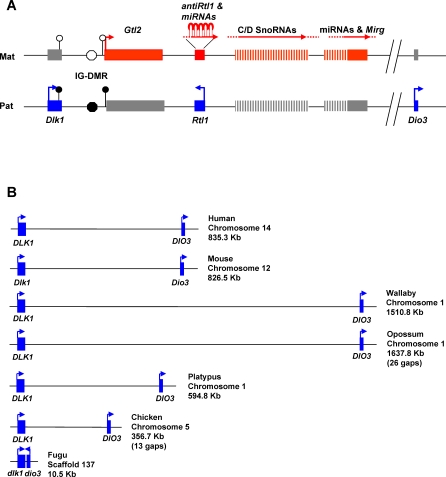
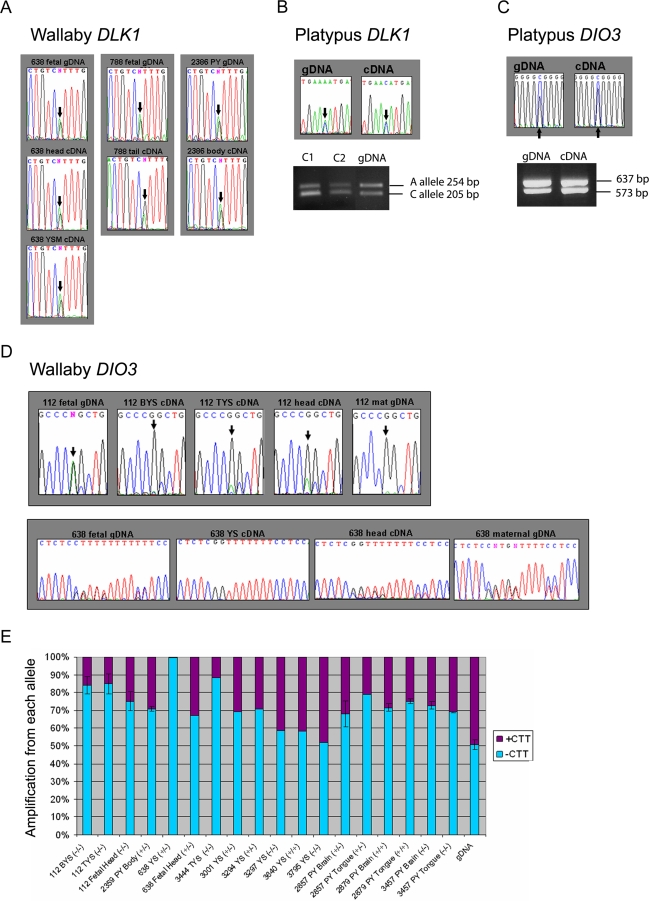
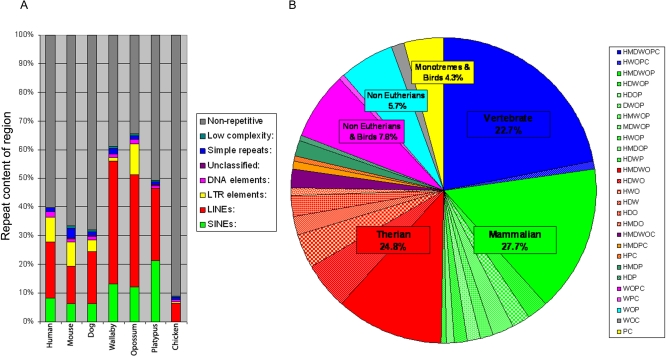
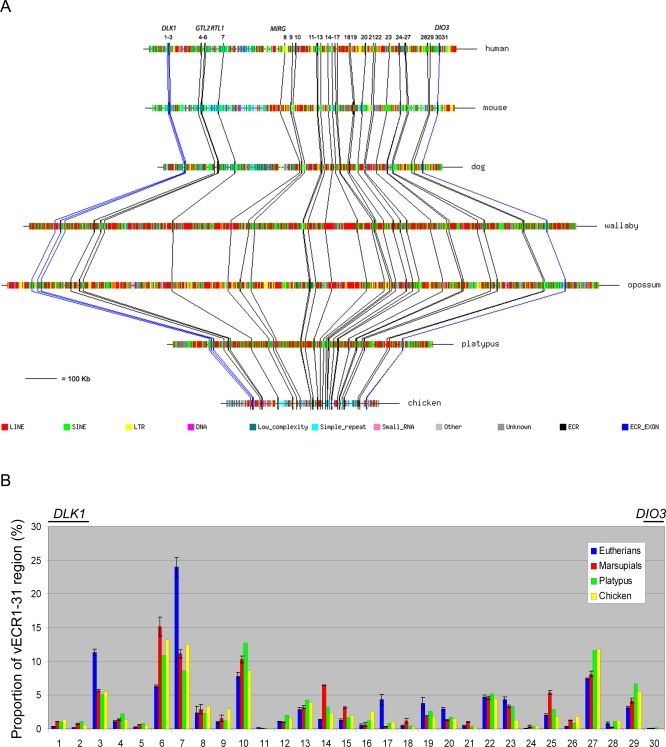
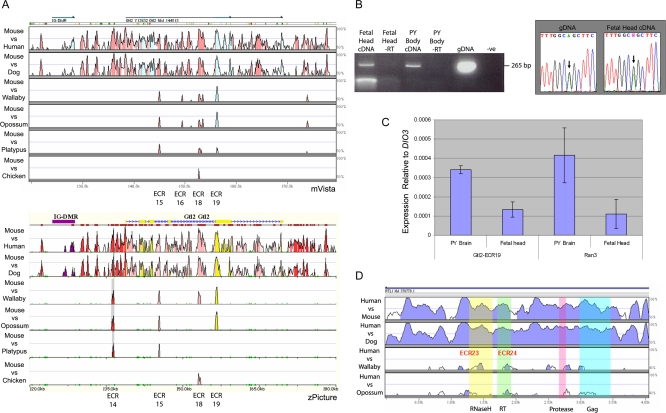
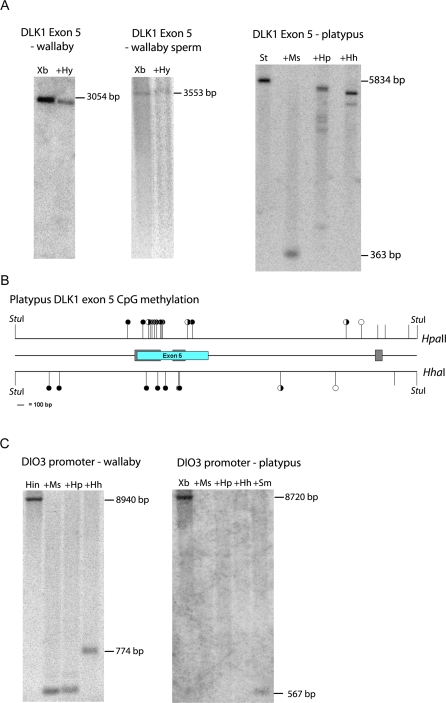
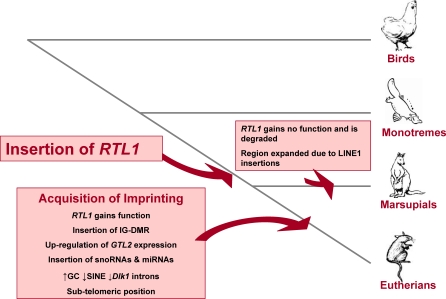
A comprehensive, domain-wide comparative analysis of genomic imprinting between mammals that imprint and those that do not can provide valuable information about how and why imprinting evolved. The imprinting status, DNA methylation, and genomic landscape of the Dlk1-Dio3 cluster were determined in eutherian, metatherian, and prototherian mammals including tammar wallaby and platypus. Imprinting across the whole domain evolved after the divergence of eutherian from marsupial mammals and in eutherians is under strong purifying selection. The marsupial locus at 1.6 megabases, is double that of eutherians due to the accumulation of LINE repeats. Comparative sequence analysis of the domain in seven vertebrates determined evolutionary conserved regions common to particular sub-groups and to all vertebrates. The emergence of Dlk1-Dio3 imprinting in eutherians has occurred on the maternally inherited chromosome and is associated with region-specific resistance to expansion by repetitive elements and the local introduction of noncoding transcripts including microRNAs and C/D small nucleolar RNAs. A recent mammal-specific retrotransposition event led to the formation of a completely new gene only in the eutherian domain, which may have driven imprinting at the cluster.


Conflict of interest statement

Competing interests. The authors have declared that no competing interests exist.

Figures

Figure 1
Figure 1. Dlk1-Dio3 in Vertebrates
(A) Schematic representation of the Dlk1-Dio3 domain in mouse showing genes expressed from the paternal chromosome (blue) and noncoding RNAs (red) expressed from the maternally inherited chromosome. The imprinting control region for the domain is the paternally methylated IG-DMR (circle). Also shown are differentially methylated regions in exon 5 of Dlk1 and the promoter region of Gtl2. Filled circles, methylated; open circlesn unmethylated. Not drawn to scale. (B) The relative positions of DLK1 and DIO3 in vertebrates. The domain sizes were calculated from the start codon of DLK1 to the stop codon of DIO3. (Genome builds were human March 2006, mouse February 2006, opossum January 2006, chicken May 2006, and fugu October 2004).
Figure 2
Figure 2. Biallelic Expression of DLK1 and DIO3 in Wallaby and Platypus
(A) DLK1 is biallelically expressed in tammar wallaby. The imprinting status of wallaby DLK1 was determined by analyzing cDNAs shown here from three individuals (638, 788, and 2386) heterozygous for a G/A single nucleotide polymorphism (SNP) in exon 4 at 374 bp from translational start. Biallelic expression was observed in yolk sac placenta (YSM), fetal head, fetal tail, and pouch young (PY) body. Results were confirmed with three further SNPs in the 5′ UTR (Figure S2). (B) DLK1 is biallelically expressed in platypus. An A/C SNP was identified in the 3′ UTR of the platypus DLK1 gene 1,323 bp from the translational start. Sequence analysis of cDNA generated from an informative platypus primary fibroblast cell line demonstrated biallelic expression. The C allele of the SNP introduces an NlaIII into the region. RFLP analysis confirms biallelic expression of platypus DLK1. (C) DIO3 is biallelically expressed in the platypus. Two polymorphisms in platypus DIO3 were identified in two different primary fibroblast cell lines—a G/C SNP and a 64 bp indel. RT-PCR analysis demonstrates biallelic expression. (D) Two polymorphisms were identified in wallaby DIO3, a CTT indel and a G/A SNP. Preferential expression was observed from the –CTT/G allele, which was particularly evident in yolk sac placenta samples. (E) Quantitative RT-PCR was used to assess the expression from each DIO3 allele in 12 different heterozygous individuals compared with a standard curve of two gDNA mixed at different ratios. Genomic DNA from all individuals was also tested and compared to the standard curve. Where more than one cDNA was analysed the data were combined and ± standard error are shown. All tissues tested displayed biased expression of the –CTT allele regardless of its parent of origin. BYS, bilaminar yolk sac; TYS, trilaminar yolk sac; YS, yolk sac; and mat, maternal gDNA. The maternal genotype for each individual is are shown in parentheses.
Figure 3
Figure 3. The Genome Landscape and ECRs
(A) Repeat content of the DLK1-DIO3 region in seven vertebrates. The region in both marsupials contains greater than 60% repeats, most of which are LINE1s. The platypus region contains approximately 50% repeats—this is a higher proportion than identified in the eutherian domain despite the region being 28% smaller in platypus. The platypus domain is depleted in LTR repeats. (B) Distribution of the 141 ECRs identified. ECR groups are arranged according to the sub-classes of vertebrates they are identified in. Vertebrate: identified in at least one eutherian, one marsupial, platypus, and chicken. Mammalian: identified in at least one eutherian, one marsupial, and platypus. Therian: identified in three therians including one eutherian and one marsupial. H, human; M, mouse; D, dog; W, wallaby; O, opossum; P, platypus; C, chicken.
Figure 4
Figure 4. Comparative Analysis of Inter-ECR Zones in the DLK1-DIO3 Domain
(A) ECRs identified in all seven species are shown as blue (Dlk1 and Dio3 exons) or black lines. The ECRs are linked to their orthologues in the neighbouring species in order to illustrate the repeat content and relative expansions/contraction within each sequence. (B) The length of each inter-ECR zones from vECR1 (DLK1 exon 3) to vECR31 (DIO3) as a proportion of the length of the domain in eutherians, marsupials, platypus, and chicken. Zone 1 = vECR1–vECR2, zone 2 = vECR2–vECR3, etc. Mean ± standard error for the three eutherians and the two marsupials are shown.
Figure 5
Figure 5. Assessment of Noncoding RNA Transcription
(A) Identification of ECRs in the Gtl2 region in noneutherians. mLAGAN and zPicture alignments of mouse Gtl2 with human, dog, wallaby, opossum, platypus, and chicken are shown. Four intronic ECRs are identified and one (ECR19) aligns within exon 5 of NM_144513. ECR14 is inverted in the eutherians and was only identified using the zPicture alignment. Weak expression was identified for ECRs14, 15, 18 and 19. RT-PCR for ECR19 in fetal head and pouch young body is shown. (B) Weak expression from ECR19 in tammar wallaby fetal head and pouch young. An A/G SNP was identified in ECR19 and biallelic expression was observed. (C) The expression ratio of ECR19 and Random Primer set 3 relative to DIO3 in fetal head and pouch young brain as calculated by quantative RT-PCR. (D) A region orthologous to the retrotransposon-derived gene Rtl1 was identified in marsupials. The mLAGAN algorithm was used to align human RTL1 with mouse, dog, wallaby, and opossum. Regions with homology of >55% over 80 bp are shown in blue. Regions of human RTL1 with homology to the Sushi-ichi domains are highlighted. Homology between the eutherian and marsupial regions indicates that RTL1 inserted into the region before the divergence of eutherians and metatherians.
Figure 6
Figure 6. Methylation Analysis of DLK1 Exon 5 and DIO3 Promoter in Wallaby and Platypus
(A) Hypermethylation was observed in both the wallaby and platypus DLK1 exon 5 regions. Wallaby genomic DNA from d23 RPY fetus (gDNA) and wallaby sperm gDNA was digested with XbaI (Xb), further digested with HpyCH4IV (Hy) and analysed by Southern blot hybridisation using MeDLK1Ex5 as a probe. Platypus gDNA was digested with StuI (St) and further with MspI (Ms), HpaII (Hp), and HhaI (Hh) and analysed by Southern blot hybridisation using OaDLK1Ex5 as a probe. (B) A map depicting the HpaII and HhaI sites and methylation status in Dlk1 exon 5. Black circles indicate methylated sites, white circles unmethylated sites, and half black circles indicate partial methylation. CpG islands in the region are shown as grey boxes. (C) The Dio3 promoter region is unmethylated in both wallaby and platypus. Wallaby fetal head gDNA was digested with HindIII and further with MspI (Ms), HpaII (Hp), and HhaI (Hh) and hydridised with MeDIO3CpG. The methylation-sensitive HpaII and HhaI tracks exhibited full digestion indicating the region is unmethylated. Platypus gDNA was digested with XbaI (Xb) then with MspI (Ms), HpaII (Hp), HhaI (Hh), or SmaI (Sm) and hydridised with OaDIO3CpG. High CG content results in many HpaII and HhaI fragments, which are unmethylated and too small to be resolved on this filter. The smallest SmaI site expected was identified, showing the platypus Dio3 promoter is unmethylated. Control hybridisation with a OaDIO3 promoter proximal probe identified a fully methylated XbaI fragment of >3 kb in the HpaII, HhaI, and SmaI tracks, confirming the integrity of the genomic DNA in these tracks (unpublished data).
Figure 7
Figure 7. Evolution of the Dlk1-Dio3 Domain in Mammals.
Schematic illustration of the evolution of the Dlk1-Dio3 domain in mammals. RTL1 retrotransposed into the region before the divergence of the eutherians and metatherians. In the marsupial lineage, RTL1 did not gain a function (or lose it) and became degraded. The region expanded approximately 2-fold in the marsupials; this expansion is mainly due to the accumulation of LINE1 repeats. The snoRNA and miRNA clusters arose after eutherian diverged from marsupials but before the mammalian radiation which took place around 98 million years ago. The eutherian region has also evolved many genomic features associated with imprinted clusters. The entire domain has become increasingly GC-rich, whereas a decline in GC content is the general trend in eutherian genomes. There are fewer SINEs than expected in the region, and the introns of the DLK1 transcript have become shorter. Finally the region has a sub-telomeric position within the eutherian genome whereas in monotremes and marsupials it is in the middle of the chromosome arm. Not drawn to scale

Similar articles

Cited by

References

    1. Edwards CA, Ferguson-Smith AC. Mechanisms regulating imprinted genes in clusters. Curr Opin Cell Biol. 2007;19:281–289. - PubMed
    1. Constancia M, Kelsey G, Reik W. Resourceful imprinting. Nature. 2004;432:53–57. - PubMed
    1. Kaneko-Ishino T, Kohda T, Ono R, Ishino F. Complementation hypothesis: the necessity of a monoallelic gene expression mechanism in mammalian development. Cytogenet Genome Res. 2006;113:24–30. - PubMed
    1. Charalambous M, Ferguson-Smith AC, Da Rocha ST. Genomic imprinting, growth control and the allocation of nutritional resources: consequences for postnatal life. Curr Opin Endocrin Diabetes, Obesity. 2007;14:3–12. - PubMed
    1. Isles AR, Davies W, Wilkinson LS. Genomic imprinting and the social brain. Philos Trans R Soc Lond B Biol Sci. 2006;361:2229–2237. - PMC - PubMed

Publication types