

Review
doi: 10.1038/nrmicro1845.
Mathematical models of infectious disease transmission
Affiliations
- PMID: 18533288
- PMCID: PMC7097581
- DOI: 10.1038/nrmicro1845
Item in Clipboard
Review
Mathematical models of infectious disease transmission
Nat Rev Microbiol.
2008 Jun.
Abstract
Mathematical analysis and modelling is central to infectious disease epidemiology. Here, we provide an intuitive introduction to the process of disease transmission, how this stochastic process can be represented mathematically and how this mathematical representation can be used to analyse the emergent dynamics of observed epidemics. Progress in mathematical analysis and modelling is of fundamental importance to our growing understanding of pathogen evolution and ecology. The fit of mathematical models to surveillance data has informed both scientific research and health policy. This Review is illustrated throughout by such applications and ends with suggestions of open challenges in mathematical epidemiology.
Figures
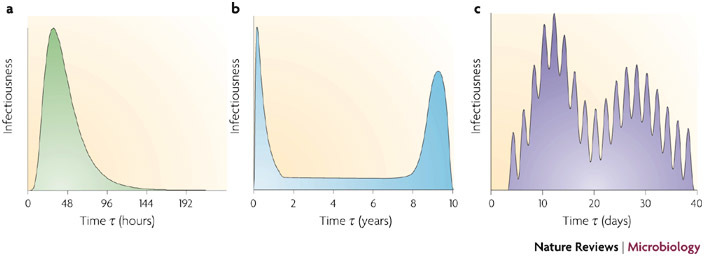
a | Influenza A; based on viral shedding in experimental human infections. b | HIV-1; based on retrospective analysis of HIV-1-discordant couples and viral-load data. c | Malaria; infectiousness to mosquitoes of infected humans based on the detection of infectious gametocytes in the blood after therapeutic treatment of syphilis by inoculation with Plasmodium vivax.
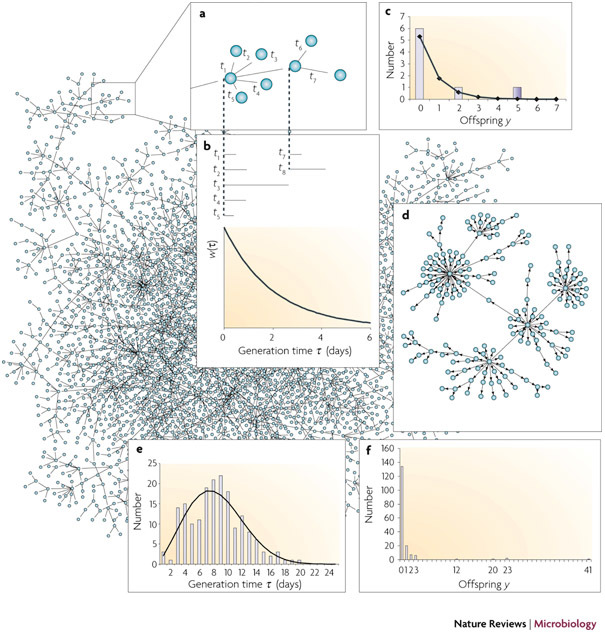
If each individual infects, on average, more than one additional individual then an epidemic can occur. A transmission tree is provided that shows who has infected who during a computer-generated epidemic in a closed population of 5,000 individuals. a | The expanded part of the transmission tree shows more clearly who infected who: in this example the index case infects five individuals, only one of whom goes on to infect other individuals. The branch lengths have been drawn to scale for the time between infection events. b | The generation-time distribution w(τ) follows the exponential distribution. The distribution of new infections that are generated by each infected individual is known as the offspring distribution. c | The offspring distribution (bars) is compared to the geometric distribution (line) that is expected for an infection with a constant infectiousness and constant rate of recovery from infection. If epidemiological data are available to link cases to their probable infection source, a transmission tree (or network if re-infection occurs) can be constructed and the generation time and offspring distribution estimated. d | A transmission tree for a severe acute respiratory syndrome (SARS) epidemic in Singapore based on 182 cases with sufficient epidemiological data to link cases,. e | The generation-time distribution (with a Weibull curve fitted) inferred from the transmission tree. f | The highly skew offspring distribution inferred from the transmission tree.
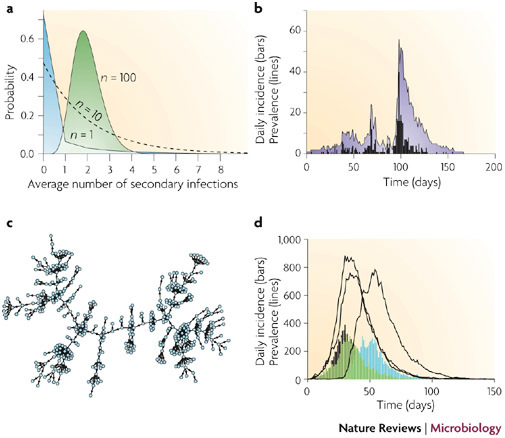
a | The distribution of the average number of secondary infections for n = 1, 10 and 100 infected individuals when the underlying offspring distribution is highly skew (following the negative binomial distribution with mean 2 and dispersion parameter k = 0.1, which corresponds to the estimates for severe acute respiratory syndrome (SARS) and measles from Ref. 21). b | In a small population of 500 individuals, the simulated emergent population dynamics of a susceptible–infected–recovered (SIR) model of infection can show complex, resurgent behaviour owing to the small number of infected individuals at any time. c | The resulting transmission tree shows a similar pattern to that observed for SARS in Singapore, where a few individuals were responsible for most new infections. d | In a larger simulated population of 10,000, the daily incidence of infection is sufficiently large for the average number of new infections to approach the normal distribution and the emergent population dynamics to show a classic epidemic pattern. Stochastic effects might still be important, however, in the early stages of the epidemic, as shown here by three simulated epidemics that were initiated at the same time with identical parameters but produced different epidemic timing.
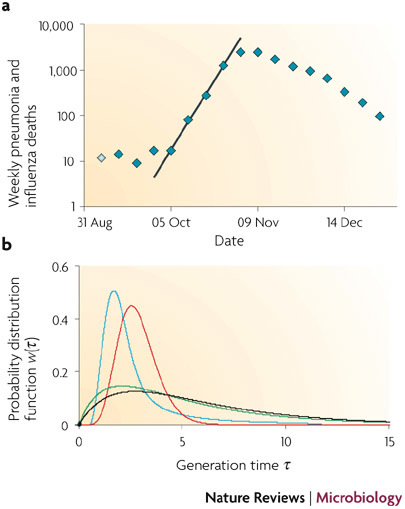
a | Pneumonia and influenza deaths during the H1N1 influenza epidemic in London in 1918 plotted on a log scale92. The line shows a good-fit exponential-growth curve with a slope of r = 0.20 per day. Similar rates of spread have been observed in cities in the United States44. b | Four different published choices of the generation-time distribution, which produce, for the same growth rate of r = 0.20 per day, estimates that range from R0 = 1.61 (blue line; mean generation time Tg = 2.7 days), R0 = 1.74 (red line; Tg = 2.9 days; assuming a gamma distribution with a variance and mean reported in Ref. 40), R0 = 2.26 (green line; Tg = 5.3 days) to R0 = 2.51 (black line; Tg = 6.0 days).
References
-
- Heesterbeek H. Ecological Paradigms Lost: Routes of Theory Change. 2005. pp. 81–105.
-
- Anderson RM, May RM. Infectious diseases of humans: dynamics and control. 1991.
Publication types
MeSH terms
LinkOut - more resources
Full Text Sources
Medical
