. 2009 Feb;19(2):349-66.
doi: 10.1093/cercor/bhn086. Epub 2008 Jun 4.

Area 3a neuron response to skin nociceptor afferent drive

Affiliations

Area 3a neuron response to skin nociceptor afferent drive

Barry L Whitsel et al. Cereb Cortex. 2009 Feb.

Abstract

Area 3a neurons are identified that respond weakly or not at all to skin contact with a 25-38 degrees C probe, but vigorously to skin contact with the probe at > or =49 degrees C. Maximal rate of spike firing associated with 1- to 7-s contact at > or =49 degrees C occurs 1-2 s after probe removal from the skin. The activity evoked by 5-s contact with the probe at 51 degrees C remains above-background for approximately 20 s after probe retraction. After 1-s contact at 55-56 degrees C activity remains above-background for approximately 4 s. Magnitude of spike firing associated with 5-s contact increases linearly as probe temperature is increased from 49-51 degrees C. Intradermal capsaicin injection elicits a larger (approximately 2.5x) and longer-lasting (100x) increase in area 3a neuron firing rate than 5-s contact at 51 degrees C. Area 3a neurons exhibit enhanced or novel responsivity to 25-38 degrees C contact for a prolonged time after intradermal injection of capsaicin or alpha, beta methylene adenosine triphosphate. Their 1) delayed and persisting increase in spike firing in response to contact at > or =49 degrees C, 2) vigorous and prolonged response to intradermal capsaicin, and 3) enhanced and frequently novel response to 25-38 degrees C contact following intradermal algogen injection or noxious skin heating suggest that the area 3a neurons identified in this study contribute to second pain and mechanical hyperalgesia/allodynia.


Figures

Figure 1.
Figure 1.
Microelectrode penetrations of area 3a. (A) Photograph of surface of squirrel monkey right hemisphere. Dots located anterior to central sulcus (CS) indicate entry point of each of the 21 microelectrode penetrations performed in the 10 subjects that yielded the data summarized in this paper. Each of these penetrations encountered area 3a nociresponsive neurons and remained within area 3a between the point of initial contact and the subcortical white matter. LF = lateral fissure. Penetrations placed anterior to the medial end of the CS (n = 3) encountered neurons activated by heated contact with skin site on the sole of the foot; penetrations anterior to lateral end of the CS (n = 18) recorded the activity of neurons activated by heated contact with a site on the palmar skin of the hand. (B) Low-power photomicrograph of Nissl-stained parasaggital section showing point of entry of microelectrode penetration (arrow) and electrolytic lesion at area 3a site (oval-shaped clear region at tip of arrow; in lamina III) where the spike discharge activity summarized in Figure 11 was recorded. Note prominent and progressive attenuation of lamina IV (dark stripe located centrally between pial surface and underlying white matter) that take place between the end of the CS and the microelectrode track (for description of cytoarchitectonic features that distinguish area 3a see Friedman and Jones 1981). (C) Intermediate power image of same section showing cytoarchitecture in regions adjacent to the above-described area 3a recording site. Open arrow indicates microelectrode track; filled arrows at pial surface identify the 3a/3b (on the left) and 3a/4 (on the right) boundaries. (D) Higher-power image showing cytoarchitectural details in immediate vicinity of the electrolytic lesion. Note presence of relatively large pyramidal cells in lamina V at locations anterior (but not posterior) to the lesion site, and highly attenuated lamina IV at anterior extreme of image (on right). Labels/tic marks on left (posterior) and right (anterior) edges of image indicate boundaries between laminae III, IV, and V. Note progressive thinning of lamina IV between left (posterior) to right (anterior) sides of image.
Figure 2.
Figure 2.
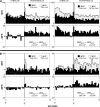
Properties of exemplary nociresponsive area 3a neurons. (Top row) Raster-type displays of spike trains recorded from 3 exemplary area 3a neurons. The activity of each neuron was recorded during and following 18 successive contacts with the same skin site—in the first 6 trials probe temperature was 38 °C; in trials 6–12 probe temperature was 51 °C; and in trials 13–18 probe temperature again was 38 °C. Vertical bar in each panel shows time of probe retraction. (Second row) Superimposed PST histograms comparing each neuron's MFR responses to 38 °C (dark shading) versus 51 °C (light shading) contact. Arrow along ordinate indicates MFR in the absence of intentional stimulation—determined during 5- to 10-s period immediately preceding onset of stimulation protocol. (Third row) Difference PSTs showing difference between MFRs (ΔMFR) recorded in trials 7–12 (test) versus trials 1–6 (control). (Bottom row) Difference PSTs showing difference between MFRs (ΔMFR) recorded in trials 13–18 (recovery) versus trials 1–6 (control).
Figure 3.
Figure 3.
Effects of exposure to 49 °C skin contact. (A) Superimposed PSTs (top panels) comparing MFR responses of neuron “A” to 38 °C skin contact versus 6, 49 °C contacts (top left) and versus additional 6, 49 °C contacts (top right). Difference PSTs (panels in second row from top) showing that neuron A gradually developed a substantial responsivity to 49 °C contact. (B) Observations from neuron “B” (same format/study design as in A). Arrow along ordinate indicates MFR in the absence of intentional stimulation—determined during 5- to 10-s period immediately preceding onset of stimulation protocol.
Figure 4.
Figure 4.
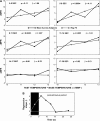
Temperature-dependence of area 3a MFR response. (A) Solid line in each panel shows average across-neuron (n = 17) difference between the MFRs (ΔMFR) associated with the “base temperature” (38 °C) and each “test” temperature (48 °C, 49 °C, 50 °C, and 51 °C) during the indicated time interval after onset of probe contact. Dotted line in each panel shows best fitting linear regression line; β = regression slope value; P = statistical significance. (B) Regression slope value varies systematically with time after stimulus onset, and is maximal during the interval 5–8 s after stimulus onset.
Figure 5.
Figure 5.
Exemplary nociresponsive area 3a neuron response to repetitive brief-contact skin stimulation. Data obtained from exemplary neurons A, B, and C (format same as Fig. 2) using the third stimulation protocol—that is, a series consisting of 8–10 1-s contacts at 38 °C (control), followed by a second series of 8–10 1-s contacts at 55 °C (test), and subsequently by another series of 8–10 1-s contacts at 38 °C (recovery). See text for details.
Figure 6.
Figure 6.
Comparison of the responses of nociresponsive area 3a neurons to long-duration (5 s) versus brief (1 s) heated skin contact stimulation. (Top plot) Average across-neuron (n = 56 neurons) difference in the MFRs (ΔMFR) evoked by 1-s contact with the probe at 25–38 °C versus 52–56 °C. See text for details. (Bottom plot) Average across-neuron (n = 34 neurons) difference in the MFRs (ΔMFR) evoked by 5-s contact with the probe at 38 °C versus 51 °C. Line superimposed on poststimulus data points in each plot is best fitting linear regression line. Regression equation shown at the upper right of each panel.
Figure 7.
Figure 7.
Location of SI neurons responsive to heated skin contact with different parts of the body. (Top center) Surface view of right hemisphere of a subject showing locations of entry points of area 3a penetrations A and B (dots anterior to central sulcus; CS), and also the entry points of 2 penetrations (x's posterior to CS; C and D), which recorded neuronal activity in area 3b. The area 3b neurons studied in penetration C were activated by cutaneous flutter stimulation of the foot; neurons studied in penetration D were activated by flutter stimulation of the hand. Figurines at top left and right are the skin sites stimulated to evoke neuron responses in penetrations A and B, respectively. (Middle) Outline drawing of Nissl-stained coronal section shows intracortical paths (“tracks”) of penetrations A and B. Cytoarchitectural features at all mediolateral levels of the this section were consistent with those described for area 3a (Friedman and Jones 1981; Jones and Porter 1980). Each site in penetrations A and B where area 3a neuron activity was recorded is indicated by a horizontal tic mark along the electrode track; total recording sites in A and B = 8. Stimulus contact duration for recordings in penetration A was 5 s; 1 s for recordings obtained in penetration B. (Bottom) Difference PSTs (ΔPSTs) showing for each recording site the difference in MFR evoked by 38 °C versus 51 °C skin contact (i.e., ΔMFR = MFR51°C contact − MFR38°C contact). ΔPSTs show that 1) for 7 of the 8 neurons studied in penetrations A and B MFR was higher during 51 °C than 38 °C contact, and 2) the increased MFR associated with 51 °C contact continued for seconds after the probe was withdrawn from the skin.
Figure 8.
Figure 8.
Representative examples of area 3a neuron response to capsaicin. Plots showing MFR of 2 simultaneously recorded area 3a neurons before, during, and subsequent to intradermal injection of 20 μL of 1% capsaicin. Onset of injection was at time 0; injection required ∼10 s to complete. The needle was withdrawn from the skin immediately after completing the injection. No mechanical or thermal stimuli were applied during the indicated time period. Note vigorous, protracted (∼1 h) and multiphasic increase in MFR that followed the injection.
Figure 9.
Figure 9.
Time course of initial phase of area 3a neuron response to capsaicin. Average normalized across-neuron (n = 21) MFR response to intradermal capsaicin injection. The activity of each area 3a neuron was recorded before and for 80 s following the injection (CAP; at time “0”). Downward arrow indicates time at which the initial increase in MFR that followed capsaicin injection declined to half-maximal. Brackets indicate ±1 SEM.
Figure 10.
Figure 10.
Comparison of the effects on area 3a neuron MFR of increasing probe temperature from 38 °C to 49 °C versus capsaicin injection. (A and B) Observations from 2 exemplary area 3a neurons. Superimposed PSTs and ΔPSTs demonstrate that for each neuron 1) the responses to 49 °C contact and to 38 °C contact after capsaicin are larger than the precapsaicin response to 38 °C contact, and 2) the precapsaicin response to 49 °C contact and the postcapsaicin response to 38 °C contact exhibit a common characteristic (i.e., a considerable fraction of the increased spike firing associated with both conditions occurs after probe withdrawal from the skin). At the time the postcapsaicin response to 38 °C contact was determined (∼1.5 h after the injection), the MFR recorded in the absence of stimulation (“spontaneous activity”, SA) differed only slightly from the SA determined prior to capsaicin injection—for neuron A precapsaicin SA was 38.7 spikes/s, postcapsaicin SA was 43.1 spikes/s; for neuron B precapsaicin SA was 9.3 spikes/s, postcapsaicin SA was 11.5 spikes/s.
Figure 11.
Figure 11.
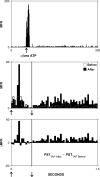
Effect of α, β methylene ATP on nociresponsive area 3a neuron. (Top) Effects of intradermal injection of α, β methylene ATP on spike discharge activity recorded in the absence of intentional stimulation. Note 1) vigorous response that accompanies the injection and persists for ∼10–15 s, and 2) the subsequent irregular and prolonged (>300 s), but relatively minor elevation of MFR. (Middle) Superimposed PSTs showing same area 3a neuron's response to 25 °C skin contact before and 20 min after the injection. (Bottom) ΔPST showing the prominent postinjection elevation of MFR that occurred both during and after 25 °C probe contact with the skin.
Figure 12.
Figure 12.
Local anesthesia of the skin reverses the capsaicin-induced enhancement of the area 3a neuron response to 25 °C mechanical skin contact. Superimposed PSTs (top row of panels) and ΔPSTs (bottom row of panels) compare the responses of a representative area 3a neuron to 1) 1-s contact at 25 °C versus 56 °C (panels in left column); 2) 1-s contact at 25 °C before versus after capsaicin injection (middle panels); and 3) the precapsaicin response to 1-s contact at 25 °C versus the response to 1-s contact at 25 °C obtained after intradermal injection of capsaicin and lidocaine (LA). Arrow along ordinate indicates MFR in the absence of intentional stimulation.
Figure 13.
Figure 13.
Quantification of area 3a neuron stimulus selectivity. Bar plot showing normalized average across-neuron (n = 19) MFR for 4 different conditions. The MFR of a neuron under the HOT TAP, CAPSAICIN, and SPONTANEOUS conditions was expressed relative to the same neuron's MFR response to TAP. For all neurons duration of TAP and HOT TAP stimulation was 1 s. See text for details.
Figure 14.
Figure 14.
Spino-cortico(area3a)–spinal positive feedback circuit enabling adaptive enhancement of lamina I dorsal horn neuron responsivity. Modification of Figure 2 in Craig (2003a). ACC = anterior cingulate cortex; MDvc = dorsomedial nucleus of thalamus; RVM = rostral ventral medulla. See text for details.

References

    1. Andrew D, Craig AD. Responses of spinothalamic lamina I neurons to maintained noxious mechanical stimulation in the cat. J Neurophysiol. 2002;87:1889–1901. - PubMed
    1. Baron R, Baron Y, Disbrow E, Roberts TPL. Brain processing of capsaicin-induced secondary hyperalgesia—a functional MRI study. Neurology. 1999;53:548–557. - PubMed
    1. Baron R, Baron Y, Disbrow E, Roberts TPL. Activation of the somatosensory cortex during Aβ-fiber mediated hyperalgesia—a MSI study. Brain Res. 2000;871:75–82. - PubMed
    1. Baumann TK, Simone DA, Shain CN, LaMotte RH. Neurogenic hyperalgesia: The search for the primary afferent fibers that contribute to capsaicin-induced pain and hyperalgesia. J Neurophysiol. 1991;66:212–227. - PubMed
    1. Bushnell MC, Duncan GH, Hofbauer RK, Ha B, Chen JI, Carrier B. Pain perception: Is there a role for primary somatosensory cortex? Proc Natl Acad Sci USA. 1999;96:7705–7709. - PMC - PubMed

Publication types

MeSH terms

Substances