

Compensatory evolution in RNA secondary structures increases substitution rate variation among sites
- PMID: 18535013
- PMCID: PMC2734131
- DOI: 10.1093/molbev/msn130
Compensatory evolution in RNA secondary structures increases substitution rate variation among sites
Abstract
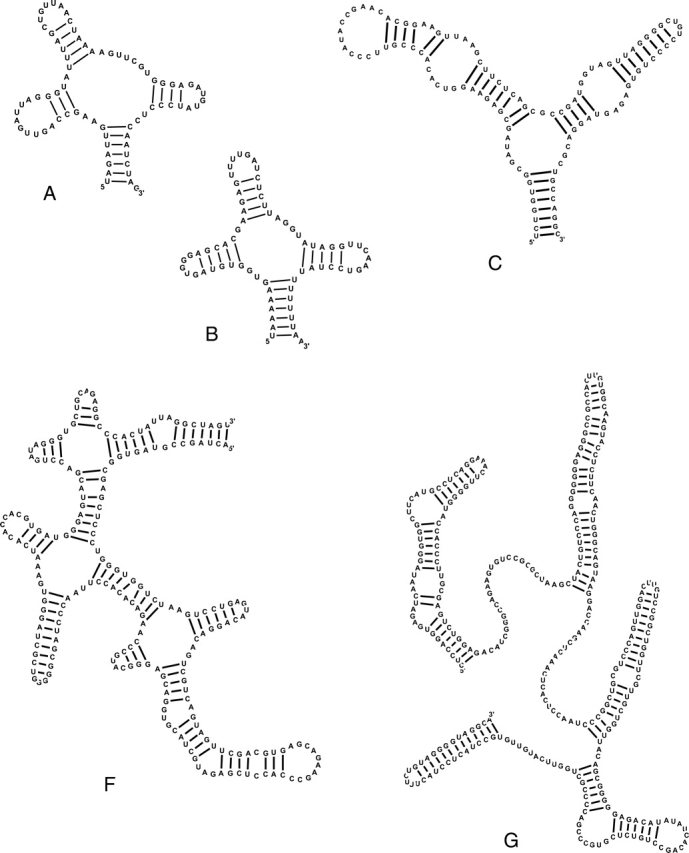
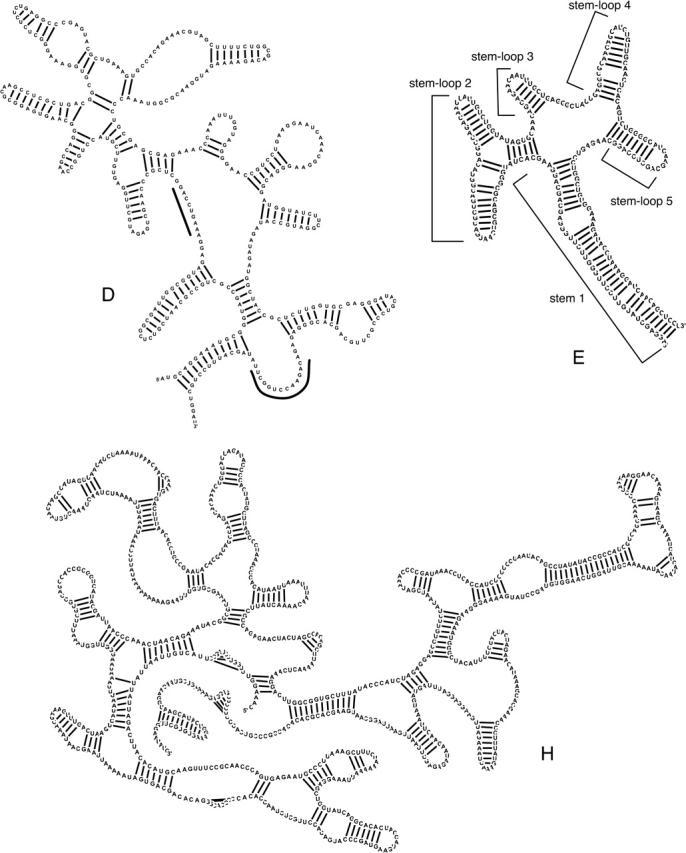
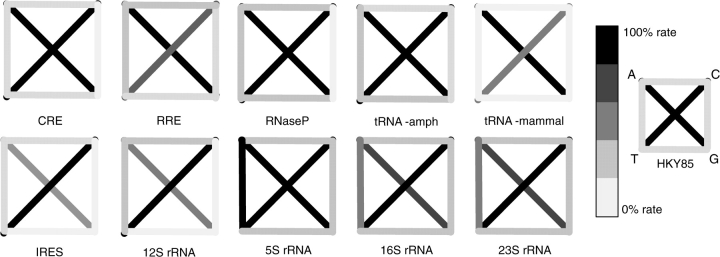
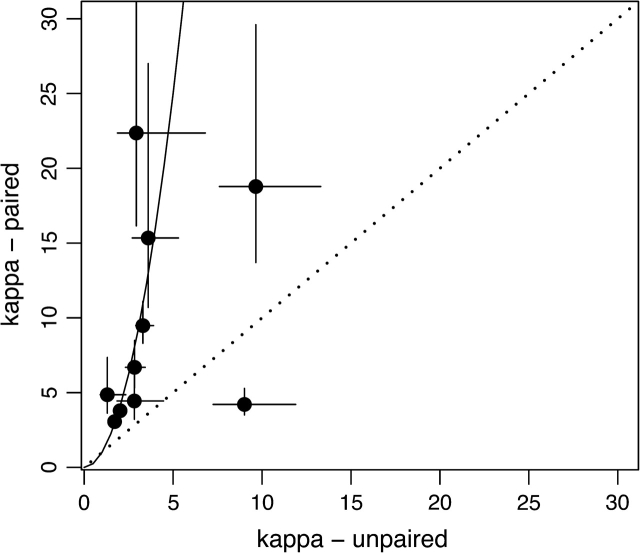
There is growing evidence that interactions between biological molecules (e.g., RNA-RNA, protein-protein, RNA-protein) place limits on the rate and trajectory of molecular evolution. Here, by extending Kimura's model of compensatory evolution at interacting sites, we show that the ratio of transition to transversion substitutions (kappa) at interacting sites should be equal to the square of the ratio at independent sites. Because transition mutations generally occur at a higher rate than transversions, the model predicts that kappa should be higher at interacting sites than at independent sites. We tested this prediction in 10 RNA secondary structures by comparing phylogenetically derived estimates of kappa in paired sites within stems (kappa(p)) and unpaired sites within loops (kappa(u)). Eight of the 10 structures showed an excellent match to the quantitative predictions of the model, and 9 of the 10 structures matched the qualitative prediction kappa(p) > kappa(u). Only the Rev response element from the human immunovirus (HIV) genome showed the reverse pattern, with kappa(p) < kappa(u). Although a variety of evolutionary forces could produce quantitative deviations from the model predictions, the reversal in magnitude of kappa(p) and kappa(u) could be achieved only by violating the model assumption that the underlying transition (or transversion) mutation rates were identical in paired and unpaired regions of the molecule. We explore the ability of the APOBEC3 enzymes, host defense mechanisms against retroviruses, which induce transition mutations preferentially in single-stranded regions of the HIV genome, to explain this exception to the rule. Taken as a whole, our findings suggest that kappa may have utility as a simple diagnostic to evaluate proposed secondary structures.
Figures
Similar articles
-
Human APOBEC3 induced mutation of human immunodeficiency virus type-1 contributes to adaptation and evolution in natural infection.PLoS Pathog. 2014 Jul 31;10(7):e1004281. doi: 10.1371/journal.ppat.1004281. eCollection 2014 Jul. PLoS Pathog. 2014. PMID: 25080100 Free PMC article.
-
Comparison of SIV and HIV-1 genomic RNA structures reveals impact of sequence evolution on conserved and non-conserved structural motifs.PLoS Pathog. 2013;9(4):e1003294. doi: 10.1371/journal.ppat.1003294. Epub 2013 Apr 4. PLoS Pathog. 2013. PMID: 23593004 Free PMC article.
-
A model of compensatory molecular evolution involving multiple sites in RNA molecules.J Theor Biol. 2016 Jan 7;388:96-107. doi: 10.1016/j.jtbi.2015.10.008. Epub 2015 Oct 24. J Theor Biol. 2016. PMID: 26506471
-
APOBEC Enzymes: Mutagenic Fuel for Cancer Evolution and Heterogeneity.Cancer Discov. 2015 Jul;5(7):704-12. doi: 10.1158/2159-8290.CD-15-0344. Epub 2015 Jun 19. Cancer Discov. 2015. PMID: 26091828 Free PMC article. Review.
-
[Molecular evolution of physiologically functioning anti-retroviral APOBEC3 deaminases].Uirusu. 2012 Jun;62(1):27-38. doi: 10.2222/jsv.62.27. Uirusu. 2012. PMID: 23189822 Review. Japanese.
Cited by
-
Strong epistatic selection on the RNA secondary structure of HIV.PLoS Pathog. 2014 Sep 11;10(9):e1004363. doi: 10.1371/journal.ppat.1004363. eCollection 2014 Sep. PLoS Pathog. 2014. PMID: 25210786 Free PMC article.
-
Characterization of Variant RNAs Encapsidated during Bromovirus Infection by High-Throughput Sequencing.Pathogens. 2024 Jan 22;13(1):96. doi: 10.3390/pathogens13010096. Pathogens. 2024. PMID: 38276169 Free PMC article.
-
A comprehensive comparison of general RNA-RNA interaction prediction methods.Nucleic Acids Res. 2016 Apr 20;44(7):e61. doi: 10.1093/nar/gkv1477. Epub 2015 Dec 15. Nucleic Acids Res. 2016. PMID: 26673718 Free PMC article.
-
Reconstruction of ancestral RNA sequences under multiple structural constraints.BMC Genomics. 2016 Nov 11;17(Suppl 10):862. doi: 10.1186/s12864-016-3105-4. BMC Genomics. 2016. PMID: 28185557 Free PMC article.
-
RNA Secondary Structure Alteration Caused by Single Nucleotide Variants.Methods Mol Biol. 2023;2586:107-120. doi: 10.1007/978-1-0716-2768-6_7. Methods Mol Biol. 2023. PMID: 36705901
References
-
- Fox GE, Woese CR. 5S-Rna secondary structure. Nature. 1975;256:505–507. - PubMed
Publication types
MeSH terms
Substances
Grants and funding
LinkOut - more resources
Full Text Sources
Other Literature Sources
