. 2008 Jul;131(Pt 7):1759-75.
doi: 10.1093/brain/awn098. Epub 2008 Jun 5.

Clinical and radiographic spectrum of pathologically confirmed tumefactive multiple sclerosis

Affiliations

Clinical and radiographic spectrum of pathologically confirmed tumefactive multiple sclerosis

C F Lucchinetti et al. Brain. 2008 Jul.

Abstract

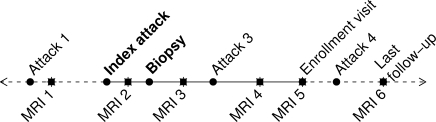
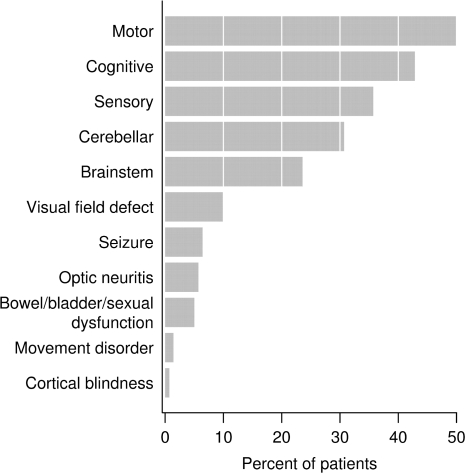
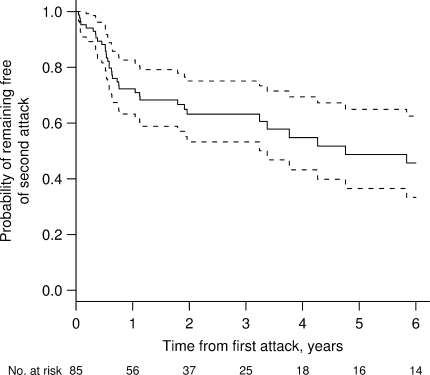
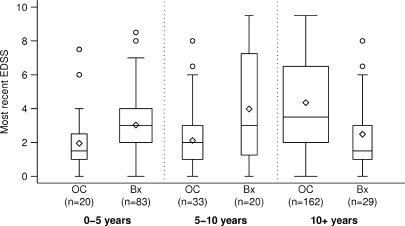
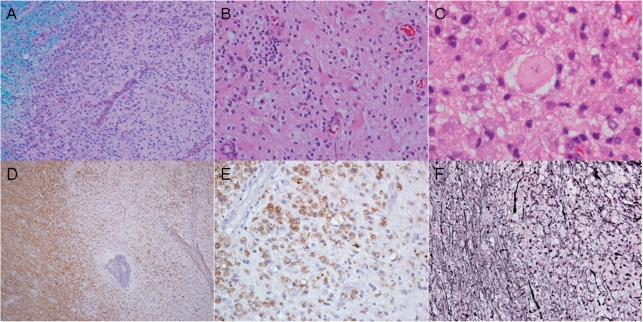
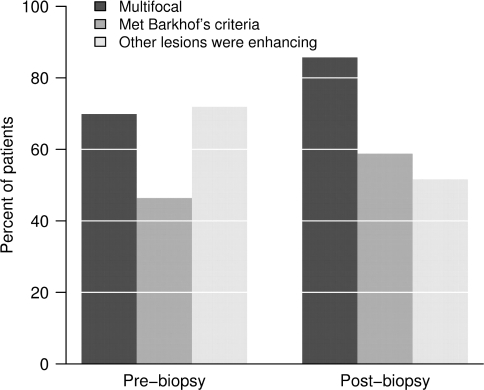
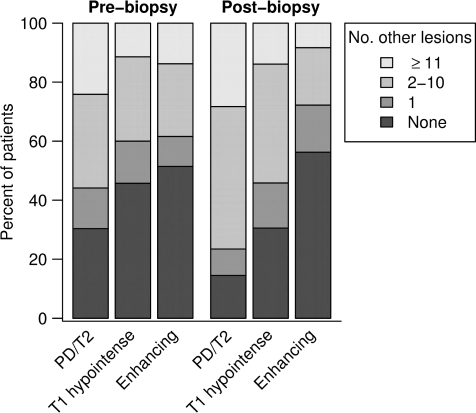
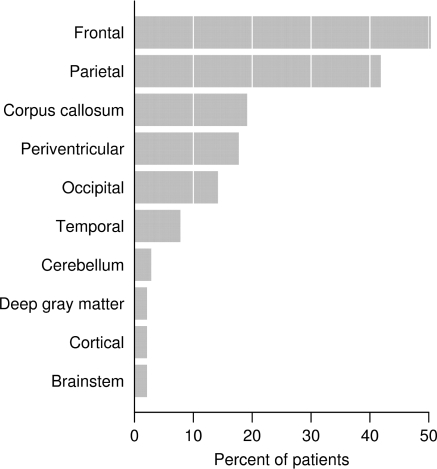
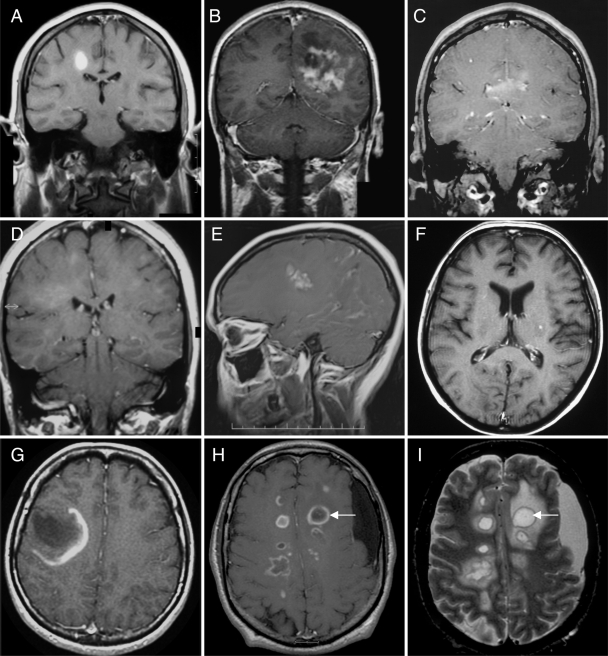
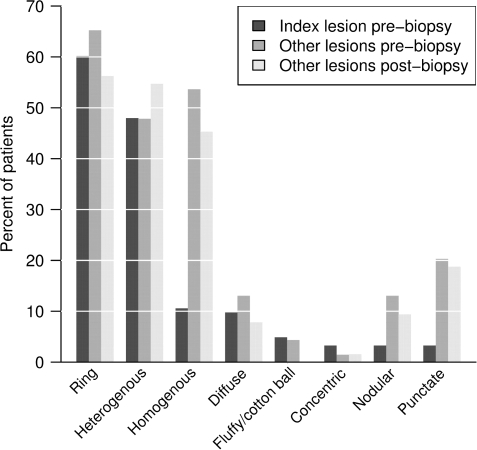
Atypical imaging features of multiple sclerosis lesions include size >2 cm, mass effect, oedema and/or ring enhancement. This constellation is often referred to as 'tumefactive multiple sclerosis'. Previous series emphasize their unifocal and clinically isolated nature, however, evolution of these lesions is not well defined. Biopsy may be required for diagnosis. We describe clinical and radiographic features in 168 patients with biopsy confirmed CNS inflammatory demyelinating disease (IDD). Lesions were analysed on pre- and post-biopsy magnetic resonance imaging (MRI) for location, size, mass effect/oedema, enhancement, multifocality and fulfilment of Barkhof criteria. Clinical data were correlated to MRI. Female to male ratio was 1.2 : 1, median age at onset, 37 years, duration between symptom onset and biopsy, 7.1 weeks and total disease duration, 3.9 years. Clinical course prior to biopsy was a first neurological event in 61%, relapsing-remitting in 29% and progressive in 4%. Presentations were typically polysymptomatic, with motor, cognitive and sensory symptoms predominating. Aphasia, agnosia, seizures and visual field defects were observed. At follow-up, 70% developed definite multiple sclerosis, and 14% had an isolated demyelinating syndrome. Median time to second attack was 4.8 years, and median EDSS at follow-up was 3.0. Multiple lesions were present in 70% on pre-biopsy MRI, and in 83% by last MRI, with Barkhof criteria fulfilled in 46% prior to biopsy and 55% by follow-up. Only 17% of cases remained unifocal. Median largest lesion size on T2-weighted images was 4 cm (range 0.5-12), with a discernible size of 2.1 cm (range 0.5-7.5). Biopsied lesions demonstrated mass effect in 45% and oedema in 77%. A strong association was found between lesion size, and presence of mass effect and/or oedema (P < 0.001). Ring enhancement was frequent. Most tumefactive features did not correlate with gender, course or diagnosis. Although lesion size >5 cm was associated with a slightly higher EDSS at last follow-up, long-term prognosis in patients with disease duration >10 years was better (EDSS 1.5) compared with a population-based multiple sclerosis cohort matched for disease duration (EDSS 3.5; P < 0.001). Given the retrospective nature of the study, the precise reason for biopsy could not always be determined. This study underscores the diagnostically challenging nature of CNS IDDs that present with atypical clinical or radiographic features. Most have multifocal disease at onset, and develop RRMS by follow-up. Although increased awareness of this broad spectrum may obviate need for biopsy in many circumstances, an important role for diagnostic brain biopsy may be required in some cases.


Figures

Fig. 1
Fig. 1
Prototypical timeline for study participant. The pre-biopsy MRI interval represents the time between MRI 1 and brain biopsy, whereas the post-biopsy MRI interval represents the time between biopsy and last MRI (MRI 6). Although for most patients the symptoms leading to brain biopsy (index attack) represented the first neurological event, in some cases, the neurological history antedated the index attack (attack 1). At the time of the enrolment visit, 140 patients had a face-to-face neurological history and examination, and underwent a standardized MRI study (MRI 5). Total disease duration was from the time of symptom onset (attack 1) to last follow-up.
Fig. 2
Fig. 2
Neurologic symptoms at presentation. Cognitive abnormalities were frequent, and included memory dysfunction, mental confusion and disorders of attention as well as disorders of higher cognitive function including aphasia (17%), apraxia (4%) and agnosia (4%).
Fig. 3
Fig. 3
Kaplan-Meier estimates of the probability of remaining free of a second attack among those whose biopsy was performed after the first clinical episode (n = 85). Solid line represents estimated probability, and dotted lines represent 95% CI. The median time to second clinical episode was 4.8 years. There were no specific risk factors (clinical or radiographic) identified which were associated with a greater risk of developing a second multiple sclerosis attack.
Fig. 4
Fig. 4
Comparison of disability (most recent EDSS) between biopsied cohort and OC multiple sclerosis prevalence cohort stratified by disease duration. The OC multiple sclerosis prevalence cohort is denoted by ‘OC’ and the current biopsy cohort is denoted by ‘Bx’. Boxes extend to cover the middle 50% of the data. Median EDSS scores are indicated by the horizontal lines within each box, mean scores by the diamonds. Whiskers extend to furthest observation within 1.5 IQRs, with outlying points indicated by individual circles. Although median EDSS at last follow-up was slightly higher in the biopsy cohort compared with the OC multiple sclerosis prevalence cohort in patients with disease duration between 0 and 5 years (3.0 versus 1.5; P = 0.01), and 5–10 years (3.0 versus 2.0; P = 0.04), the EDSS was significantly lower in the biopsy cohort for 10+ years (1.5 versus 3.5; P < 0.001). Note that EDSS at last follow-up was unknown in eight patients, therefore, the data reflects 132 rather than 140 biopsied patients in whom detailed clinical information was available for analysis.
Fig. 5
Fig. 5
Pathology of an Active Biopsied multiple sclerosis Lesion. Biopsies from all 168 cases demonstrated the characteristic features of active inflammatory demyelinating disease consisting of hypercellular lesions with myelin loss (A; Luxol-fast blue and periodic acid Schiff), reactive gliosis (B; haematoxylin–eosin), Creutzfeldt cells (C; haematoxylin–eosin), lipid-laden macrophages (D and E; immunocytochemistry for proteolipid protein) and relative axonal preservation (F; Bielschowsky silver impregnation).
Fig. 6
Fig. 6
Percent of patients with multifocality, who fulfilled Barkhof's criteria for multiple sclerosis, and who had other enhancing lesions (among those who were multifocal), pre/concomitant to biopsy and post-biopsy.
Fig. 7
Fig. 7
Number of non-biopsied PD/T2, T1W hypointense and enhancing lesions on pre- and post-biopsy MRI.
Fig. 8
Fig. 8
Biopsy lesion location.
Fig. 9
Fig. 9
Representative examples of different enhancement patterns. (A) homogenous; (B) heterogenous; (C) patchy and diffuse; (D) cotton-ball; (E) nodular; (F) punctate; (G) open ring; (H) multiple closed rings; (I) multiple T2 hypointense rims co-localize with ring enhancement (arrows; T2W MRI). (AH) T1W MRI + Gd.
Fig. 10
Fig. 10
Frequency of enhancement patterns of biopsied and non-biopsied lesions. The index (biopsied) lesion enhanced in 123 (95%) of the cases in whom pre-biopsy T1W Gd scans were available for review. There was no correlation between lack of enhancement on pre-biopsy MRI, and use of steroids or other immunosuppressive agents within 4 weeks of the scan of interest. Non-enhancing biopsied lesions all demonstrated pathological evidence of active demyelination.

References

    1. Al-Bunyan MA. Tumor-like presentation of multiple sclerosis. Saudi Med J. 2000;21:393–5. - PubMed
    1. Alderson L, Fetell MR, Sisti M, Hochburg F, Cohen M, Louis DN. Sentinel lesions of primary CNS lymphoma. J Neurol Neurosurg Psychiatry. 1996;60:102–5. - PMC - PubMed
    1. Annesley-Williams D, Farrell MA, Staunton H, Brett FM. Acute demyelination, neuropathological diagnosis, and clinical evolution. J Neuropathol Exp Neurol. 2000;59:477–89. - PubMed
    1. Annunziata P, Giorgio A, De Santi L, Zipoli V, Portaccio E, Amato MP, et al. Absence of cerebrospinal fluid oligoclonal bands is associated with delayed disability progression in relapsing-remitting MS patients treated with interferon-B. J Neurol Sci. 2006;244:97–102. - PubMed
    1. Atlas SW, Grossman RI, Gomori JM, Hackney DB, Goldberg HI, Zimmerman RA, et al. Hemorrhagic intracranial malignant neoplasms: spin-echo MR imaging. Radiology. 1987;164:71–7. - PubMed

Publication types