. 2008 Oct;149(10):4799-808.
doi: 10.1210/en.2008-0060. Epub 2008 Jun 5.

Altered endocrine and autocrine metabolism of vitamin D in a mouse model of gastrointestinal inflammation

Affiliations

Altered endocrine and autocrine metabolism of vitamin D in a mouse model of gastrointestinal inflammation

Nancy Liu et al. Endocrinology. 2008 Oct.

Abstract

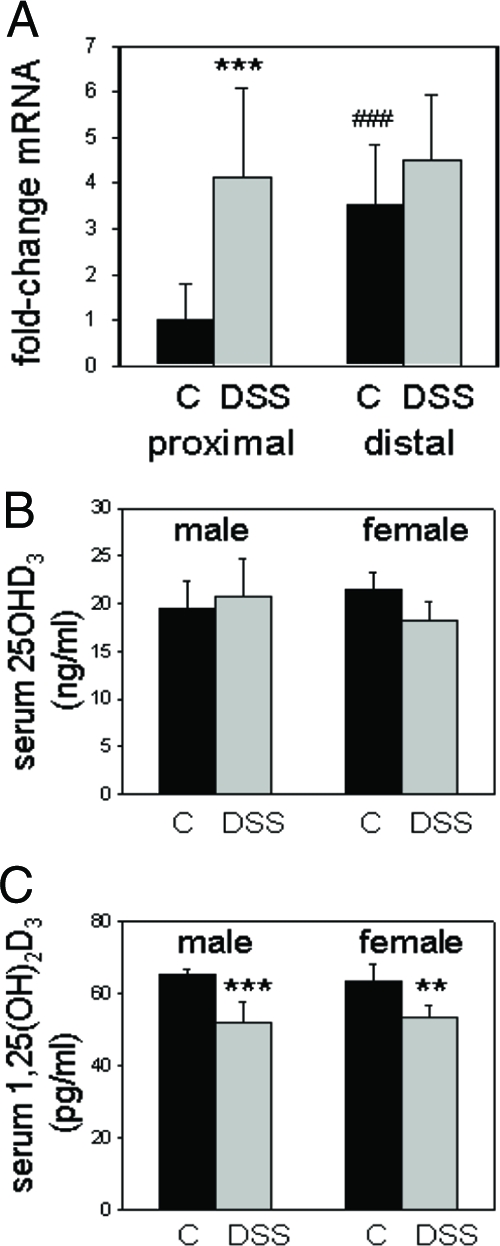
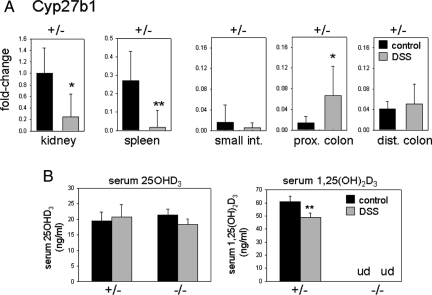
The active form of vitamin D, 1,25-dihydroxyvitamin D3, [1,25(OH)2D3] has potent actions on innate and adaptive immunity. Although endocrine synthesis of 1,25(OH)2D3 takes place in the kidney, the enzyme that catalyzes this, 25-hydroxyvitamin D-1alpha-hydroxylase (CYP27b1 in humans, Cyp27b1 in mice), is expressed at many extra-renal sites including the colon. We have shown previously that colonic expression of CYP27b1 may act to protect against the onset of colitis. To investigate this further, we firstly characterized changes in Cyp27b1 expression in a mouse model of colitis. Mice treated with dextran sodium sulfate (DSS) showed weight loss, histological evidence of colitis, and increased expression of inflammatory cytokines. This was associated with decreased renal expression of Cyp27b1 (5-fold, P=0.013) and lower serum 1,25(OH)2D3 (51.8+/-5.9 pg/nl vs. 65.1+/-1.6 in controls, P<0.001). However, expression of CYP27b1 was increased in the proximal colon of DSS mice (4-fold compared with controls, P<0.001). Further studies were carried out using Cyp27b1 null (-/-) mice. Compared with+/-controls the Cyp27b1-/-mice showed increased weight loss (4.9% vs. 22.8%, P<0.001) and colitis. This was associated with raised IL-1 in the distal colon and IL-17 in the proximal and distal colon. Conversely, DSS-treated Cyp27b1-/-mice exhibited lower IL-10 in the proximal colon and toll-like receptors 2 and 4 in the distal colon. These data indicate that both local and endocrine synthesis of 1,25(OH)2D3 affect colitis in DSS-treated mice. Lack of Cyp27b1 exacerbates disease in this model, suggesting that similar effects may occur with vitamin D deficiency.


Figures

Figure 1
Figure 1
DSS-induced colitis in C57BL/6 mice. Panel A, Weight changes (g) in 8-wk-old mice receiving regular water (control) or water with 2.5% DSS (DSS) (7 d treatment followed by 3 d recovery). Each symbol (•, ▾, ○, ▵, ▪) represents weights for individual mice. Panel B, Histological colitis scoring in control or DSS mice. Data are the mean ± sd from n = 5 mice. Panel C, Real-time RT-PCR analysis of mRNA for IL-1β in tissue from the proximal and distal colon of control and +DSS mice. Data are shown as mean fold-change in expression in +DSS mice compared with control mice (n = 5 in both cases, ± sd). Statistical analysis was carried out using raw δCt values. **, Statistically different from water control, P < 0.01; ***, statistically different from water control, P < 0.001. ###, Statistically different from DSS-treated proximal colon, P < 0.001.
Figure 2
Figure 2
Altered expression of Cyp27b1 and synthesis of 1,25(OH)2D3 in DSS-treated mice. Panel A, Real-time RT-PCR analysis of Cyp27b1 mRNA in the proximal and distal colon of 8-wk-old mice (n = 5 for each treatment) receiving regular water (control, C) or water with 2.5% DSS (DSS) (7 d treatment followed by 3 d recovery). Data are shown as mean fold-change in expression relative to proximal colon from control mice (arbitrary mean value = 1) ± sd. Statistical analysis was carried out using raw δCt values. Panel B, Levels of serum 25OHD3 in male (n = 5) and female (n = 5) wild-type C57BL/6 mice receiving regular control water (C) or water with DSS (DSS). Panel C, Levels of serum 1,25(OH)2D3 in male (n = 5) and female (n = 5) wild-type C57BL/6 mice receiving regular control water (C) or water with DSS. **, Statistically different from water control, P < 0.01; ***, statistically different from water control, P < 0.001. ###, Statistically different from proximal colon control, P < 0.001.
Figure 3
Figure 3
The effects of DSS-treatment on colonic expression of Cyp27b1 protein. Immunohistochemical analysis of Cyp27b1 protein expression in panel A, the proximal and distal colon of control or DSS-treated mice (DSS); in panel B, control immunohistochemistry using Cyp27b1 antiserum preabsorbed with immunizing peptide. All pictures show ×200 magnification; arrow indicates a lymphoid patch.
Figure 4
Figure 4
Cyp27b1 knockout mice are more susceptible to DSS-induce colitis. Panel A, Weights of wild-type (+/+), Cyp27b1 heterozygous (+/−) and Cyp27b1 knockout (−/−) mice receiving regular water (control, C) or water with 2.5% DSS (DSS) (7 d treatment followed by 3 d recovery). Data shown are mouse weights (g) on d 0 and 10. Panel B, Histological colitis scoring in Cyp27b1 heterozygous (+/−) and Cyp27b1 knockout (−/−) mice receiving regular water (control, C) or water with 2.5% DSS (DSS). Data are the mean ± sd from n = 5 mice. ***, Statistically different from water control, P < 0.001. ###, Statistically different from DSS +/− mouse, P < 0.001. ##, Statistically different from DSS +/− mouse, P < 0.01. ###, Statistically different from DSS +/− mouse, P < 0.001. Data analyzed by ANOVA.
Figure 5
Figure 5
Tissue-specific alterations in Cyp27b1 expression and activity in DSS-treated mice. Panel A, Real-time RT-PCR analysis of Cyp27b1 mRNA in kidney, spleen, small intestine (small int.), proximal colon (prox. colon), and distal colon (dist. colon) from Cyp27b1 +/− mice treated with regular water (control, dark bars) or water with 2.5% DSS (DSS, gray bars). Data shown are the mean fold-change in Cyp27b1 expression relative to control kidney tissue (mean value = 1) ± sd. Statistical analysis of real-time RT-PCR data were carried out using raw δCt values (not shown), which were used to generate p values for statistically significant differences compared with water control mRNA expression (shown for each tissue). Panel B, Levels of serum 25OHD3 and 1,25(OH)2D3 in Cyp27b1 +/− and −/− mice receiving regular control water (C) or water with DSS. n = 5 mice for all treatments. **, Statistically different from water control, P < 0.01; *, statistically different from water control, P < 0.05. Data analyzed by ANOVA.
Figure 6
Figure 6
Tissue-specific alterations in the expression of VDR and Cyp24 in DSS-treated mice. Real-time RT-PCR analysis of (panel A) VDR and (panel B) Cyp24 mRNA in kidney, spleen, small intestine, proximal colon (prox. colon), and distal colon from Cyp27b1 +/− and −/− mice treated with regular water (control, dark bars) or water with 2.5% DSS (DSS, gray bars). Data shown are the mean fold-change in gene expression relative to water control for each specific tissue (mean value = 1) ± sd. Statistical analysis of real-time RT-PCR data were carried out using raw δCt values (not shown). n = 5 mice for all treatments. Statistically significant difference in mRNA expression between equivalent samples from water control and DSS-treated animals is shown as follows: *, P < 0.05; **, P < 0.01; ***, P < 0.001. Statistically significant difference in mRNA expression between equivalent samples from Cyp27b1 +/− and −/− mice is shown as follows: #, P < 0.05; ##, P < 0.01; ###, P < 0.001. Statistically significant difference in mRNA expression between DSS-treated Cyp27b1 −/− mice and control +/− mice is shown as follows: a, P < 0.05; b, P < 0.01; c, P < 0.001. Data analyzed by ANOVA.
Figure 7
Figure 7
Tissue-specific alterations in cytokine expression in DSS-treated mice. Real-time RT-PCR analysis of (panel A) IL-1β, (panel B) IL-10, (panel C) IL-17 mRNA in kidney, spleen, small intestine (small int.), proximal colon (prox. colon), and distal colon (dist. colon) from Cyp27b1 +/− and −/− mice treated with regular water (control, dark bars) or water with 2.5% DSS (DSS, gray bars). Data shown are the mean fold-change in gene expression relative to water control for each specific tissue (mean value = 1). Statistical analysis of real-time RT-PCR data were carried out using raw δCt values (not shown). n = 5 mice for all treatments. Statistically significant difference in mRNA expression between equivalent samples from water control and DSS-treated animals is shown as follows: *, P < 0.05; **, P < 0.01; ***, P < 0.001. Statistically significant difference in mRNA expression between equivalent samples from Cyp27b1 +/− and −/− mice is shown as follows: #, P < 0.05; ##, P < 0.01; ###, P < 0.001. Statistically significant difference in mRNA expression between DSS-treated Cyp27b1 −/− mice and control +/− mice is shown as follows: a, P < 0.05; b, P < 0.01; c, P < 0.001. Data analyzed by ANOVA.
Figure 8
Figure 8
Tissue-specific alterations in toll-like receptor expression in DSS-treated mice. Real-time RT-PCR analysis of (A) toll-like receptor 2 (TLR2), (B) toll-like receptor 4 (TLR4) mRNA in kidney, spleen, small intestine (small int.), proximal colon (prox. colon), and distal colon (dist. colon) from Cyp27b1 +/− and −/− mice treated with regular water (control, dark bars) or water with 2.5% DSS (DSS, gray bars). Data shown are the mean fold-change in gene expression relative to water control for each specific tissue (mean value = 1). Statistical analysis of real-time RT-PCR data were carried out using raw δ Ct values (not shown). n = 5 mice for all treatments. Statistically significant difference in mRNA expression between equivalent samples from water control and DSS-treated animals is shown as follows: *, P < 0.05; **, P < 0.01; ***, P < 0.001. Statistically significant difference in mRNA expression between equivalent samples from Cyp27b1 +/− and −/− mice is shown as follows: #, P < 0.05; ##, P < 0.01; ###, P < 0.001. Statistically significant difference in mRNA expression between DSS-treated Cyp27b1 −/− mice and control +/− mice is shown as follows: a, P < 0.05; b, P < 0.01; c, P < 0.001. Data analyzed by ANOVA.

Similar articles

Cited by

References

    1. Adams JS, Hewison M 2008 Unexpected actions of vitamin D: new perspectives on the regulation of innate and adaptive immunity. Nat Clin Pract Endocrinol Metab 4:80–90 - PMC - PubMed
    1. Adams JS, Liu P, Chun R, Modlin RL, Hewison M 2007 Vitamin D in defense of the human immune response. Ann NY Acad Sci 1117:94–105 - PubMed
    1. Wang TT, Nestel FP, Bourdeau V, Nagai Y, Wang Q, Liao J, Tavera-Mendoza L, Lin R, Hanrahan JW, Mader S, White JH 2004 Cutting edge: 1,25-dihydroxyvitamin D3 is a direct inducer of antimicrobial peptide gene expression. J Immunol 173:2909–2912 - PubMed
    1. Gombart AF, Borregaard N, Koeffler HP 2005 Human cathelicidin antimicrobial peptide (CAMP) gene is a direct target of the vitamin D receptor and is strongly up-regulated in myeloid cells by 1,25-dihydroxyvitamin D3. FASEB J 19:1067–1077 - PubMed
    1. Yim S, Dhawan P, Ragunath C, Christakos S, Diamond G 2007 Induction of cathelicidin in normal and CF bronchial epithelial cells by 1,25-dihydroxyvitamin D(3). J Cyst Fibros 6:404–410 - PMC - PubMed

Publication types

MeSH terms