Review
. 2008 Jun;72(2):266-300, table of contents.
doi: 10.1128/MMBR.00001-08.

Regulation of pyrimidine biosynthetic gene expression in bacteria: repression without repressors

Affiliations
Review

Regulation of pyrimidine biosynthetic gene expression in bacteria: repression without repressors

Charles L Turnbough Jr et al. Microbiol Mol Biol Rev. 2008 Jun.

Abstract

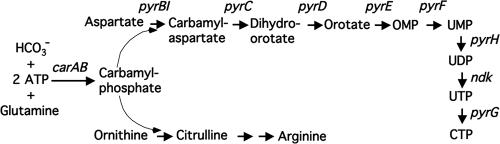
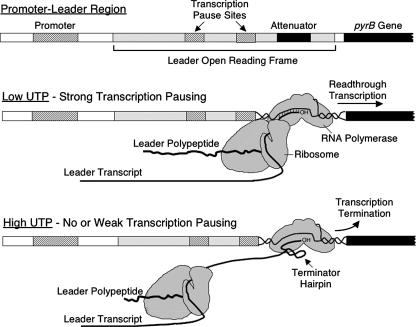
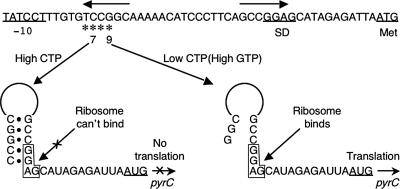
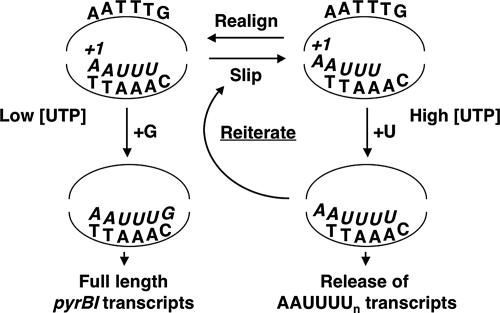
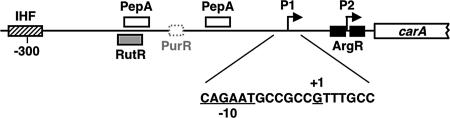
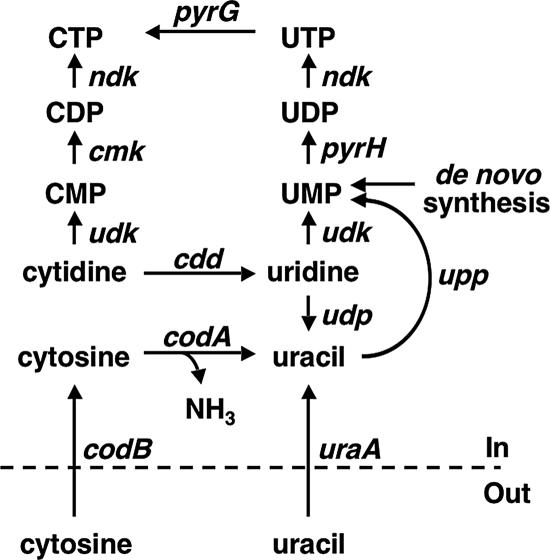
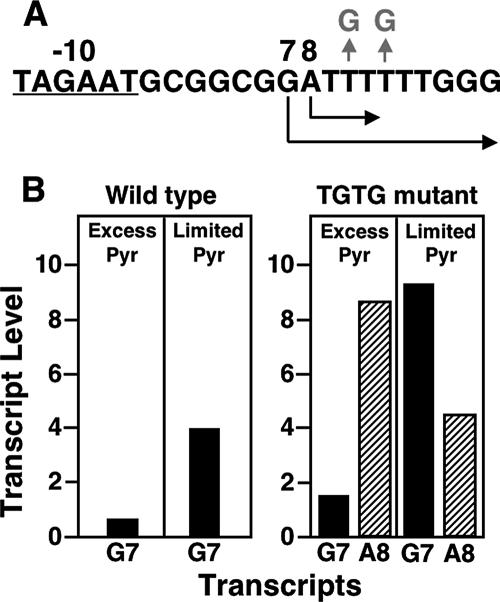
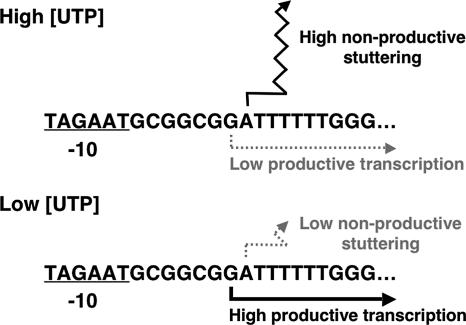
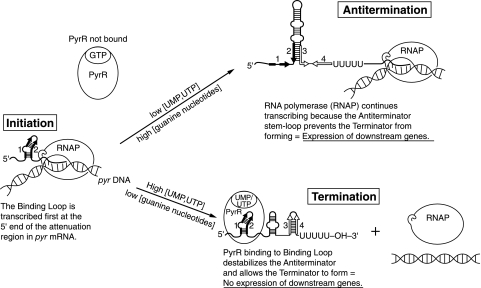
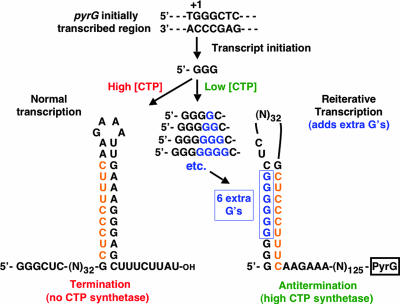
DNA-binding repressor proteins that govern transcription initiation in response to end products generally regulate bacterial biosynthetic genes, but this is rarely true for the pyrimidine biosynthetic (pyr) genes. Instead, bacterial pyr gene regulation generally involves mechanisms that rely only on regulatory sequences embedded in the leader region of the operon, which cause premature transcription termination or translation inhibition in response to nucleotide signals. Studies with Escherichia coli and Bacillus subtilis pyr genes reveal a variety of regulatory mechanisms. Transcription attenuation via UTP-sensitive coupled transcription and translation regulates expression of the pyrBI and pyrE operons in enteric bacteria, whereas nucleotide effects on binding of the PyrR protein to pyr mRNA attenuation sites control pyr operon expression in most gram-positive bacteria. Nucleotide-sensitive reiterative transcription underlies regulation of other pyr genes. With the E. coli pyrBI, carAB, codBA, and upp-uraA operons, UTP-sensitive reiterative transcription within the initially transcribed region (ITR) leads to nonproductive transcription initiation. CTP-sensitive reiterative transcription in the pyrG ITRs of gram-positive bacteria, which involves the addition of G residues, results in the formation of an antiterminator RNA hairpin and suppression of transcription attenuation. Some mechanisms involve regulation of translation rather than transcription. Expression of the pyrC and pyrD operons of enteric bacteria is controlled by nucleotide-sensitive transcription start switching that produces transcripts with different potentials for translation. In Mycobacterium smegmatis and other bacteria, PyrR modulates translation of pyr genes by binding to their ribosome binding site. Evidence supporting these conclusions, generalizations for other bacteria, and prospects for future research are presented.


Figures

FIG. 1.
FIG. 1.
Pyrimidine nucleotide biosynthetic pathway of E. coli and Salmonella. Gene names are used to represent the encoded biosynthetic enzymes. The genes shown in the figure and the encoded proteins are as follows: carA, glutaminase subunit of carbamylphosphate synthetase; carB, catalytic subunit of carbamylphosphate synthetase; pyrB, catalytic subunit of aspartate transcarbamylase; pyrI, regulatory subunit of aspartate transcarbamylase; pyrC, dihydroorotase; pyrD, dihydroorotate dehydrogenase; pyrE, orotate phosphoribosyltransferase; pyrF, OMP decarboxylase; pyrH, UMP kinase; ndk, nucleoside diphosphokinase; and pyrG, CTP synthetase.
FIG. 2.
FIG. 2.
Model for attenuation control of pyrBI expression in E. coli. The diagram shows the relative positions of RNA polymerase and the translating ribosome within the leader region when UTP concentrations are either low or high. See the text for additional details. (Modified from reference with permission.)
FIG. 3.
FIG. 3.
Model for transcription start site switching and translational control of pyrC expression in E. coli and Salmonella. The nucleotide sequence of the pyrC promoter-regulatory region of E. coli is shown, with the −10 region, SD sequence, and pyrC initiation (Met) codon underlined and labeled. Asterisks indicate the four transcription start sites at the pyrC promoter, and the two major start sites, C7 and G9, are indicated. Inverted horizontal arrows indicate the region of dyad symmetry. The sequence and structure of transcripts initiated at start sites C7 (high CTP) and G9 (low CTP) are shown, with the SD sequence boxed. Only C7 transcripts form the hairpin that includes the SD sequence and prevents translation initiation.
FIG. 4.
FIG. 4.
Model for the regulation of pyrBI expression by UTP-sensitive reiterative transcription. DNA sequences in the transcription bubble are shown, and the sequence of the nascent transcript, starting at position +1, is italicized. For details, see the text.
FIG. 5.
FIG. 5.
Promoter-regulatory region of the carAB operon of E. coli. Promoters P1 and P2 and the binding sites for IHF, PepA, RutR, PurR, and ArgR are shown. The partial sequence of promoter P1 includes the −10 region and transcription start site (+1), which are underlined.
FIG. 6.
FIG. 6.
Salvage pathways for uracil and cytosine. Gene names are used to represent the encoded proteins. Excluding those shown in Fig. 1, the genes and their encoded proteins are as follows: cdd, cytidine deaminase; cmk, CMP kinase; codA, cytosine deaminase; codB, cytosine permease; udk, uridine kinase; udp, uridine phosphorylase; upp, UPRTase; and uraA, uracil permease.
FIG. 7.
FIG. 7.
Transcription from wild-type and mutant codBA promoters. (A) Sequence of the wild-type codBA promoter region with the −10 region underlined and the G7 and A8 start sites labeled with the number 7 or 8, respectively. Horizontal arrows indicate transcription initiation at the two start sites. The two T-to-G substitutions that created the TGTG mutant promoter are shown in gray. (B) Levels of codB::lacZ transcripts initiated at the wild-type and TGTG mutant promoters. Cells carrying either the wild-type or TGTG mutant codB::lacZ fusion were grown under conditions of pyrimidine excess or limitation, and fusion transcript levels were measured by quantitative primer extension mapping (137). Transcript levels are in arbitrary units. (Modified from reference with permission from Elsevier.)
FIG. 8.
FIG. 8.
Model for UTP-sensitive regulation of codBA expression. The model shows the effects of UTP concentration on productive transcription and nonproductive reiterative transcription (or stuttering), which occurs following transcription initiation at start sites G7 and A8, respectively. (Modified from reference with permission from Elsevier.)
FIG. 9.
FIG. 9.
Promoter region sequences of the upp and codBA operons. The −10 regions are underlined, and asterisks indicate the two transcription start sites at each promoter. The start sites are numbered according to their position downstream from the −10 region.
FIG. 10.
FIG. 10.
Map of the B. subtilis pyr operon. Shaded bars indicate ORFs, and the bent arrow denotes the pyr promoter. The proteins encoded by the genes shown were identified in Fig. 1, except as follows: pyrR, pyr mRNA-binding attenuation regulatory protein; pyrP, uracil permease; pyrAA, glutamine-utilizing subunit of carbamylphosphate synthetase equivalent to carA; pyrAB, catalytic subunit of carbamylphosphate synthetase equivalent to carB; pyrK, electron-transferring accessory protein to dihdroorotate dehydrogenase. Numbers indicate the positions of nucleotides in the B. subtilis genome. (Modified from reference with permission from Elsevier.)
FIG. 11.
FIG. 11.
Predicted secondary structures of the regions of pyr transcripts specified by attenuation regions 1 (5′ leader), 2 (pyrR-pyrP), and 3 (pyrP-pyrB). Nucleotides are numbered from the start of transcription (i.e., +1). (Left side) RNA is shown folded into the binding loop, formed by base pairing of segments 1 and 2, and the terminator hairpin, formed by base pairing of segments 3 and 4, conformation. Bases involved in the formation of the alternative antiterminator stem-loop conformation are circled. (Right side) RNA is shown folded into the antiterminator stem-loop conformation. (Modified from reference .)
FIG. 12.
FIG. 12.
Mechanism of PyrR-mediated transcription attenuation control of pyr operon expression in B. subtilis. For simplicity, only transcription of the pyr 5′-leader attenuation region is shown. For details, see the text. (Modified from reference .)
FIG. 13.
FIG. 13.
Elements in the pyr binding loop RNA that are important for PyrR binding and pyr operon regulation. Nucleotides are numbered as in Fig. 11. (A) Mutations in the pyr 5′ leader RNA that cause a loss of repression by pyrimidines. (B) Protection against hydroxyl radical cleavage of binding loop 2 RNA by PyrR and mapping of secondary structure by nuclease digestion. Sites adjacent to nucleotides shown in blue were strongly protected against hydroxyl radical cleavage, the site adjacent to the nucleotide in red was moderately protected, and sites adjacent to nucleotides in green were weakly protected. Arrows with circles indicate sites of cleavage by a single-strand-specific nuclease (RNase I), arrows with squares indicate sites of cleavage by a double-strand-specific nuclease (RNase V1), and S and W denote strong and weak cleavage, respectively. Suggested alternative structures for the terminal loop of the RNA hairpin are shown in circles. (C) Specificity of PyrR binding to binding loop 2 RNA determined by gel mobility shift analysis. Residues shown in red cannot be replaced without loss of binding, residues in green can be replaced as long as the secondary structure of the RNA is preserved, and residues in black can be replaced or deleted. (D) Consensus sequence and structure of the PyrR binding site. The consensus structure was derived from 20 binding loops identified in pyr operons of gram-positive bacteria. Secondary structures were predicted by MFOLD (R = A or G, Y = U or C, and N = any nucleotide). Parentheses indicate nucleotides present in only some species. In 8 of 20 examples, the U nucleotide shown in a dashed circle is part of the internal loop, which directs the predicted alternative base pairing shown with dashed lines. The sequences and base pairs shown in boxes are highly but not universally conserved. (Panel A is reprinted from reference with permission from Elsevier; panels B and D are reprinted from reference with permission from Oxford University Press.)
FIG. 14.
FIG. 14.
Ribbon diagram of the crystal structure of PyrR from B. caldolyticus. Each polypeptide chain is shown in a distinct color. (A) The native tetrameric structure. (B) One of the two identical dimeric structures that combine to form the tetramer. Very similar dimeric structures are found in PyrR from other species. The black circles indicate the location of bound Mg2+ ions. The stick structures indicate the locations of 5′-UMP bound to the active site of the green subunit, 5′-GMP bound to the active site of the purple subunit, and 3′-GMP bound in a crystal contact lattice. (Reprinted from reference .)
FIG. 15.
FIG. 15.
Model for CTP-mediated regulation of pyrG expression in B. subtilis. The figure shows the effects of CTP concentration on the fate of the pyrG transcript after the first three G residues have been incorporated into the nascent transcript. A high CTP concentration allows normal transcript elongation until intrinsic termination occurs in the pyrG leader region. A low CTP concentration induces a transcription pause that allows reiterative transcription and the addition of extra G residues, which participate in the formation of an antiterminator hairpin. The extra G residues are boxed. The figure shows the insertion of six extra G residues, but as many as 10 extra residues can be added. (Modified from reference with permission of the publisher. Copyright 2004 National Academy of Sciences, U.S.A.)

References

    1. Abd-el-Al, A., and J. L. Ingraham. 1969. Control of carbamyl phosphate synthesis in Salmonella typhimurium. J. Biol. Chem. 2444033-4038. - PubMed
    1. Amiott, E. A., and J. A. Jaehning. 2006. Sensitivity of the yeast mitochondrial RNA polymerase to +1 and +2 initiating nucleotides. J. Biol. Chem. 28134982-34988. - PubMed
    1. Andersen, J. T., K. F. Jensen, and P. Poulsen. 1991. Role of transcription pausing in the control of the pyrE attenuator in Escherichia coli. Mol. Microbiol. 5327-333. - PubMed
    1. Andersen, L., M. Kilstrup, and J. Neuhard. 1989. Pyrimidine, purine and nitrogen control of cytosine deaminase synthesis in Escherichia coli K 12. Involvement of the glnLG and purR genes in the regulation of codA expression. Arch. Microbiol. 152115-118. - PubMed
    1. Andersen, P. S., D. Frees, R. Fast, and B. Mygind. 1995. Uracil uptake in Escherichia coli K-12: isolation of uraA mutants and cloning of the gene. J. Bacteriol. 1772008-2013. - PMC - PubMed

Publication types

LinkOut - more resources