. 2008 Jun 6;320(5881):1332-6.
doi: 10.1126/science.1156947.

Subdiffraction multicolor imaging of the nuclear periphery with 3D structured illumination microscopy

Affiliations

Subdiffraction multicolor imaging of the nuclear periphery with 3D structured illumination microscopy

Lothar Schermelleh et al. Science. .

Abstract

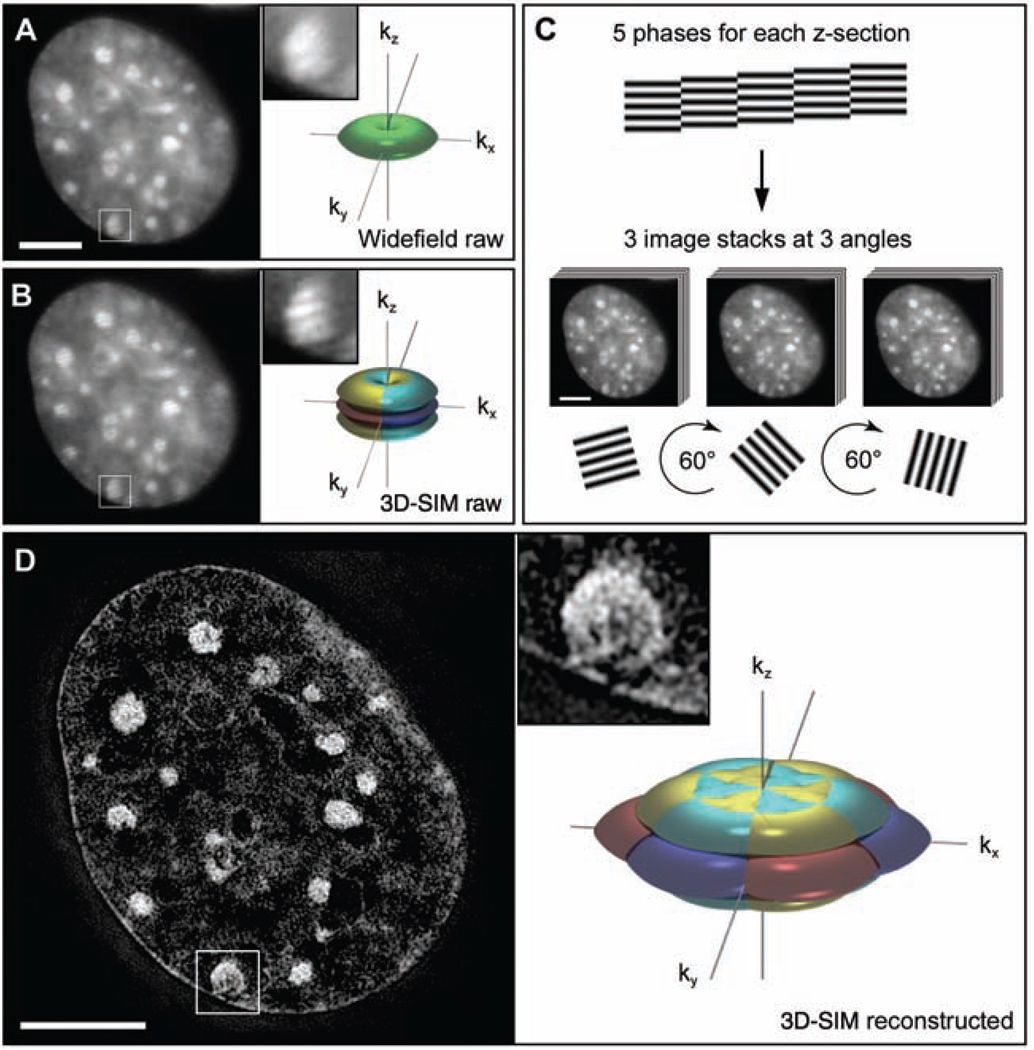
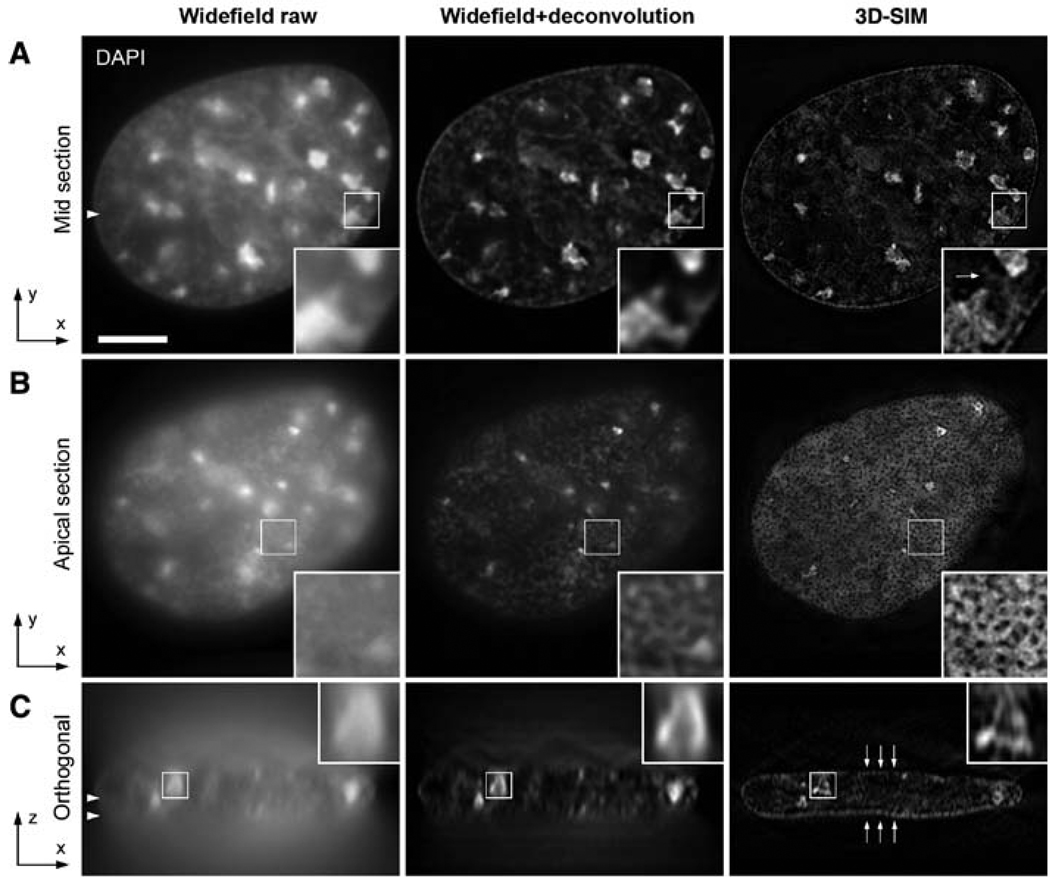
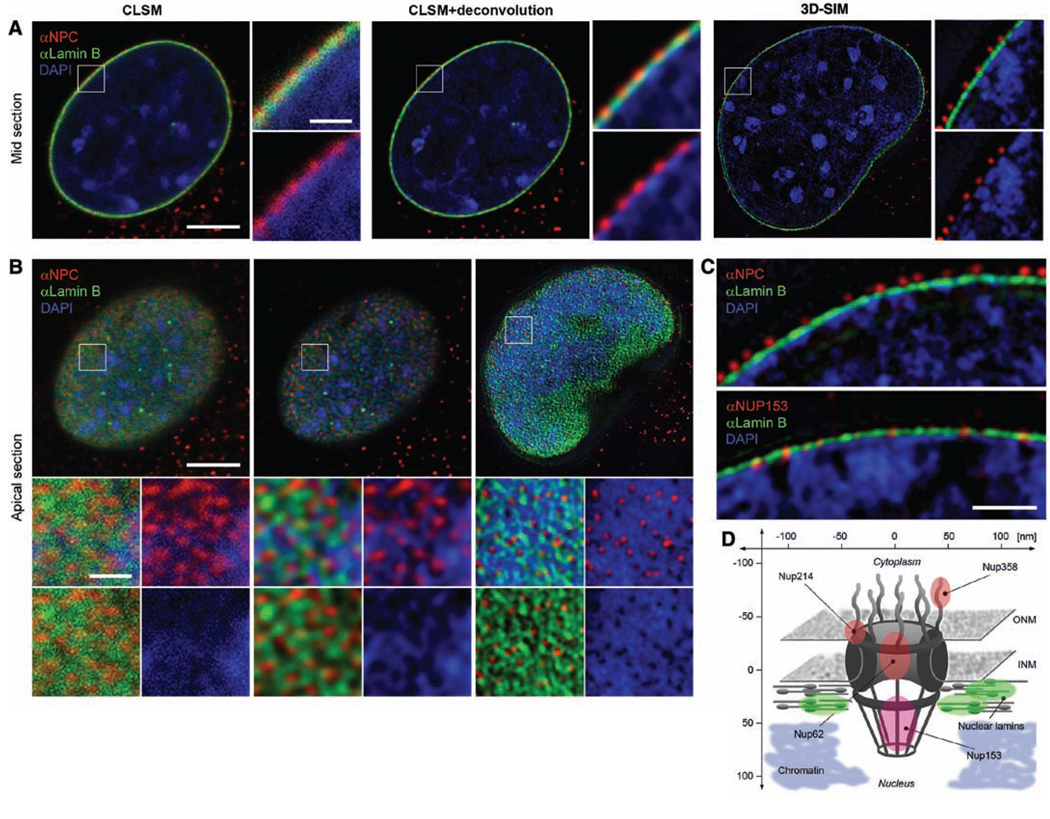
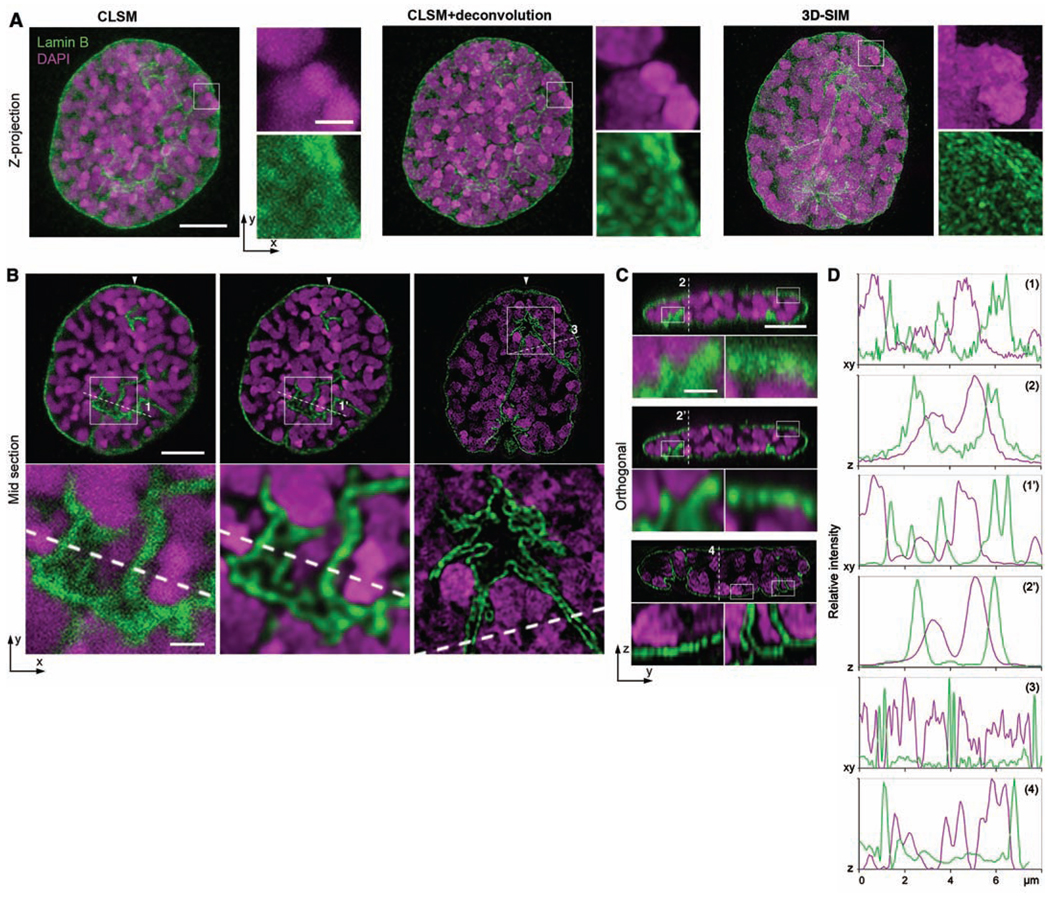
Fluorescence light microscopy allows multicolor visualization of cellular components with high specificity, but its utility has until recently been constrained by the intrinsic limit of spatial resolution. We applied three-dimensional structured illumination microscopy (3D-SIM) to circumvent this limit and to study the mammalian nucleus. By simultaneously imaging chromatin, nuclear lamina, and the nuclear pore complex (NPC), we observed several features that escape detection by conventional microscopy. We could resolve single NPCs that colocalized with channels in the lamin network and peripheral heterochromatin. We could differentially localize distinct NPC components and detect double-layered invaginations of the nuclear envelope in prophase as previously seen only by electron microscopy. Multicolor 3D-SIM opens new and facile possibilities to analyze subcellular structures beyond the diffraction limit of the emitted light.


Figures

Fig. 1
Fig. 1
Subdiffraction resolution imaging with 3D-SIM. (A and B) Cross section through a DAPI-stained C2C12 cell nucleus acquired with conventional wide-field illumination (A) and with structured illumination (B), showing the striped interference pattern (inset). The renderings to the right illustrate the respective support of detection in frequency space. The axes kx, ky, and kz indicate spatial frequencies along the x, y, and z directions. The surfaces of the renderings represent the corresponding resolution limit. The depression of the frequency support (“missing cone”) in z direction in (A) indicates the restriction in axial resolution of conventional wide-field microscopy. With 3D-SIM, the axial support is extended but remains within the resolution limit. (C) Five phases of the sine wave pattern are recorded at each z position, allowing the shifted components to be separated and returned to their proper location in frequency space. Three image stacks are recorded with the diffraction grating sequentially rotated into three positions 60° apart, resulting in nearly rotationally symmetric support over a larger region of frequency space. (D) The same cross section of the reconstructed 3D-SIM image shows enhanced image details compared with the original image (insets). The increase in resolution is shown in frequency space on the right, with the coverage extending two times farther from the origin. Scale bars indicate 5 µm.
Fig. 2
Fig. 2
Comparison of wide-field imaging and 3D-SIM in resolving interphase chromatin fine structure. 3D image stacks of the same DAPI-stained C2C12 cell nucleus were recorded with conventional wide-field illumination (left) and with 3D-SIM (right). Deconvolution was applied to the wide-field data set (middle). Scale bar, 5 µm. Arrowheads indicate the position of the respective cutting planes. (A) Mid cross section shows brightly stained chromocenters of clustered (peri-)centromeric heterochromatin. (Insets) Higher-detail information of chromatin substructures when recorded with 3D-SIM. Arrow points to a less-bright chromatin structure that has been spuriously eroded by the deconvolution procedure. (B) Projection of four apical sections (corresponding to a thickness of 0.5 µm) taken from the surface of the nuclear envelope closest to the coverslip. Whereas the raw image shows diffuse DAPI staining, the deconvolved image shows more pronounced variations in fluorescence intensities. Image data with 3D-SIM extended-resolution information reveal a punctuated pattern of regions devoid of DAPI staining. (C) Orthogonal cross-section through the entire 3D image stack demonstrates the low sectioning capability of conventional wide-field microscopy, which cannot be mitigated solely by deconvolution. In contrast, clear layers of peripheral heterochromatin can be resolved with 3D-SIM (arrows).
Fig. 3
Fig. 3
Simultaneous imaging of DNA, nuclear lamina, and NPC epitopes by 3D-SIM. C2C12 cells are immunostained with antibodies against lamin B (green) and antibodies that recognize different NPC epitopes (red). DNA is counterstained with DAPI (blue). (A) Central cross sections. (B) Projections of four apical sections (corresponding to a thickness of 0.5 µm). Boxed regions are shown below at 4× magnification; scale bars indicate 5 µm and 1 µm, respectively. (A) CLSM and deconvolution still show partially overlapping signals. In contrast, with 3D-SIM the spatial separation of NPC, lamina, and chromatin and chromatin-free channels underneath nuclear pores are clearly visible. (B) Top view on the nuclear envelope. Whereas CLSM fails to resolve close nuclear pores, 3D-SIM shows clearly separated NPC signals at voids of peripheral chromatin and surrounded by an irregular network of nuclear lamina. (C) Mid sections comparing stainings with an antibody that mainly reacts with Nup214, Nup358, and Nup62 (αNPC) and one specifically recognizing Nup153 (αNup153). The αNPC signal is above the lamina (140 ± 8 nm), whereas the αNup153 pore signal is at the same level as the lamina (−15 ± 20 nm). Scale bars 1 µm. (D) Schematic outline of the NPC, showing the relative position of Nup proteins and surrounding structures. ONM, outer nuclear membrane; INM, inner nuclear membrane.
Fig. 4
Fig. 4
Invaginations of the nuclear envelope in mitotic prophase. C2C12 cells are immunostained with antibodies against lamin B (green), and the DNA is counterstained with DAPI (magenta). (A) Maximum intensity projections, (B) lateral, and (C) orthogonal cross sections. Scale bars, 5 µm. Inset boxes are shown below at 4× magnification (scale bars, 1 µm). 3D-SIM reveals the globular substructure of condensed chromosomes and the fine-structured fibrillar network of the nuclear lamina (movie S2). (D) Lateral and axial line profiles of dashed lines in (B) and (C), respectively. Whereas the lateral peak widths are only slightly decreased in the lateral direction (1 versus 1′), the axial profiles show clearly decreased peak widths after deconvolution, indicating a substantial improvement of axial resolution (2 versus 2′). With 3D-SIM, the peak widths of the lamin B signal are about halved with respect to the deconvolved confocal image in lateral and axial directions, and double peaks are resolved where only single peaks are seen in the confocal profiles. Similarly, DAPI staining shows multiple small peaks, which again reflects the increase of image details in 3D-SIM.

References

    1. Born M, Wolf E, editors. Principle of Optics. Cambridge: Cambridge Univ. Press; 1998.
    1. Pawley JB, editor. Handbook of Biological Confocal Microscopy. ed. 3. New York: Springer; 2006.
    1. Abbe E. Arch. Mikrosk. Anat. 1873;9:413.
    1. Gustafsson MG, et al. Biophys. J. in press; published online 7 March 2008 (10.1529/biophysj.107.120345)
    1. Gustafsson MG. J. Microsc. 2000;198:82. - PubMed

Publication types

MeSH terms