. 2008 Sep;64(3):240-5.
doi: 10.1203/PDR.0b013e318180e47a.

Changes in cell-cycle kinetics responsible for limiting somatic growth in mice

Affiliations

Changes in cell-cycle kinetics responsible for limiting somatic growth in mice

Maria Chang et al. Pediatr Res. 2008 Sep.

Abstract

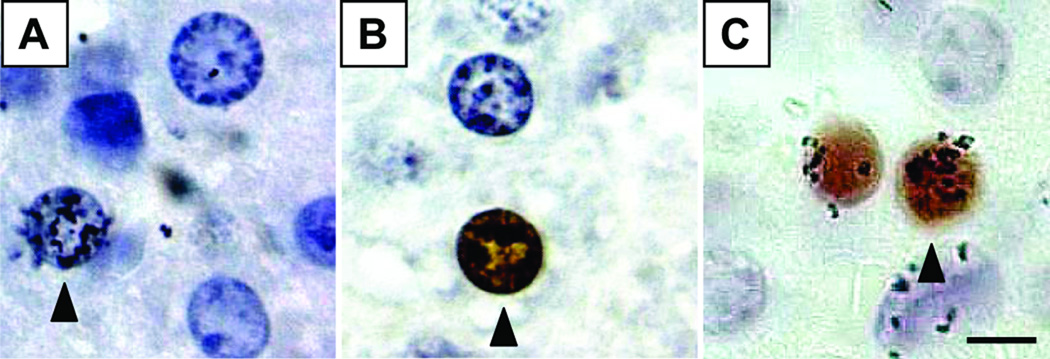
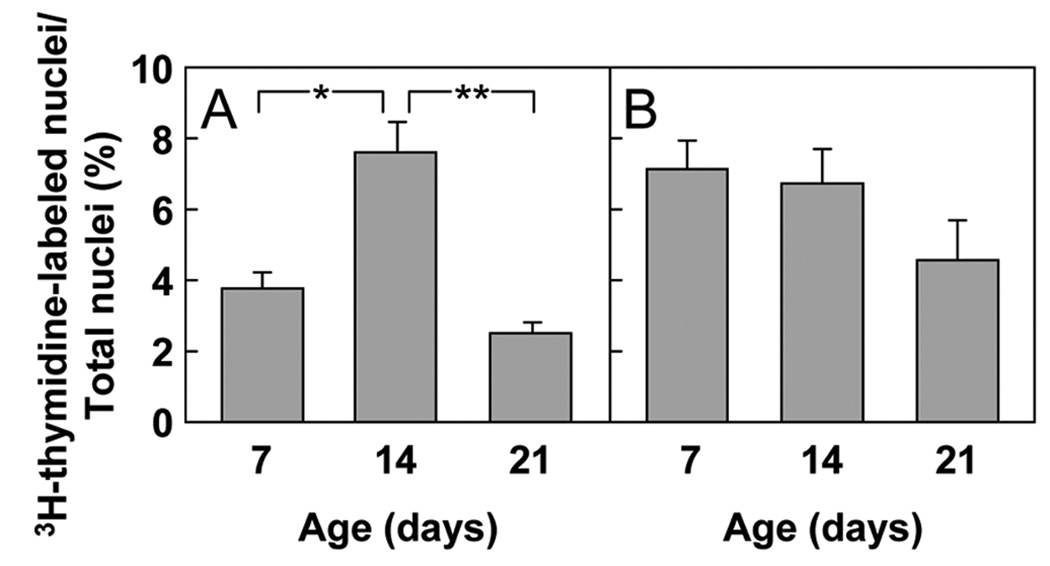
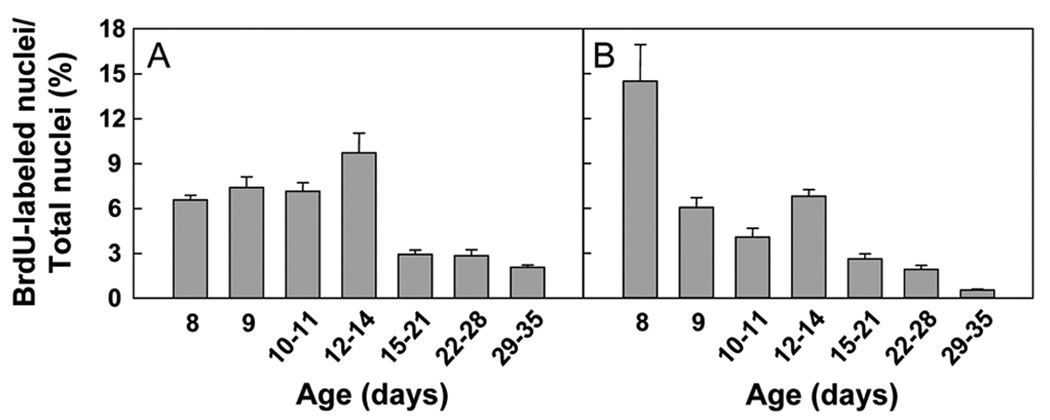
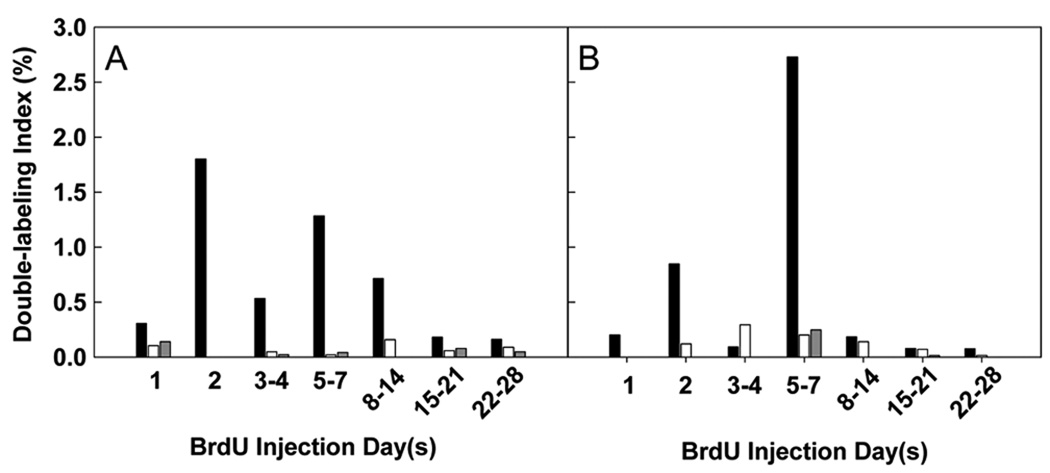
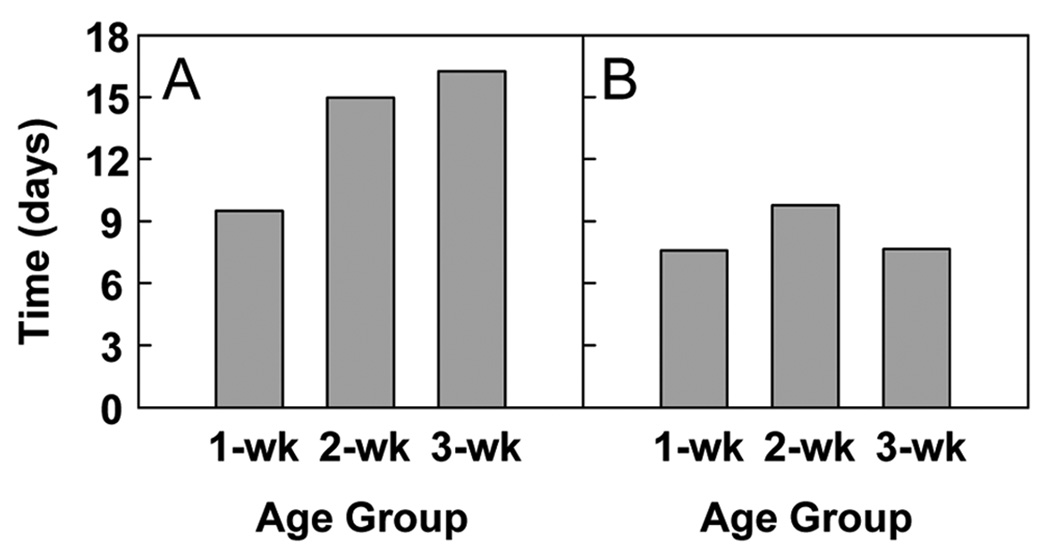
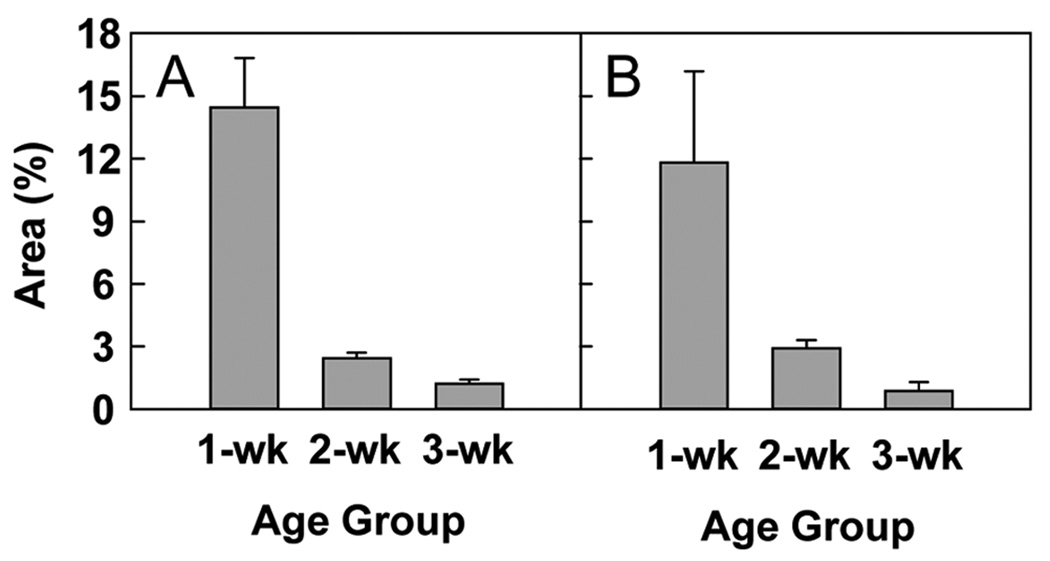
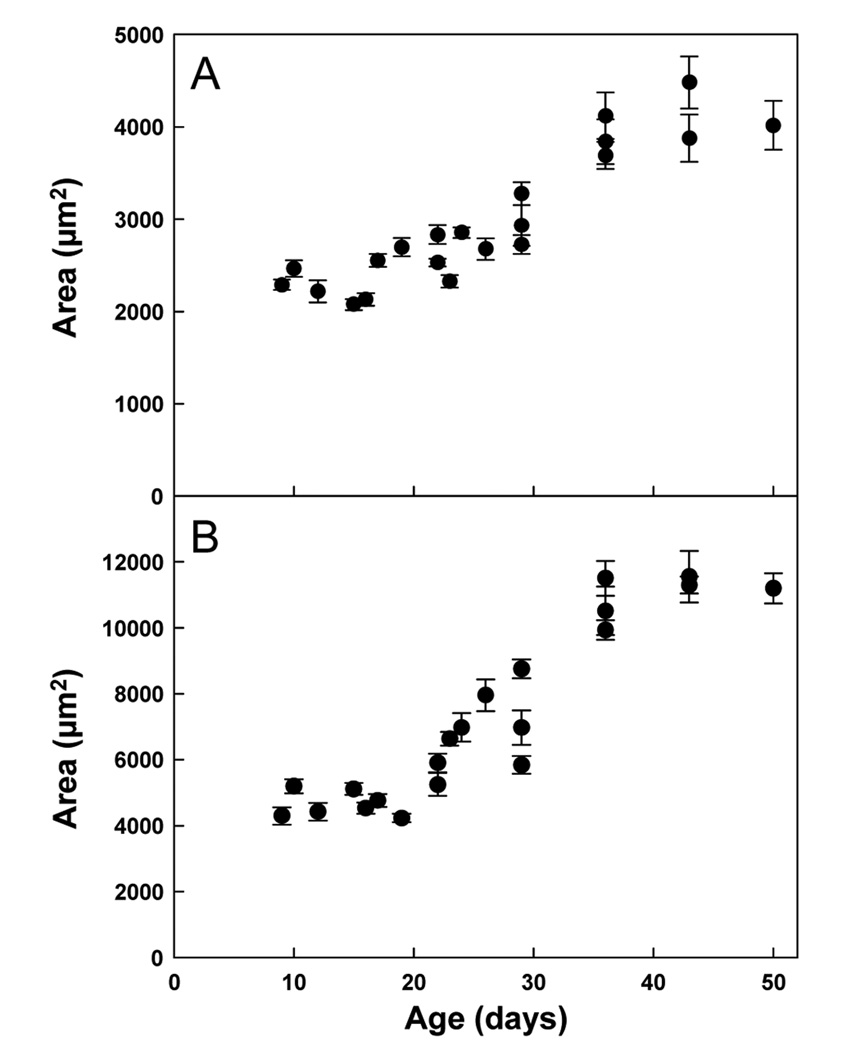
In mammals, the rate of somatic growth is rapid in early postnatal life but then slows with age, approaching zero as the animal approaches adult body size. To investigate the underlying changes in cell-cycle kinetics, [methyl-H]thymidine and 5'-bromo-2'deoxyuridine were used to double-label proliferating cells in 1-, 2-, and 3-wk-old mice for four weeks. Proliferation of renal tubular epithelial cells and hepatocytes decreased with age. The average cell-cycle time did not increase in liver and increased only 1.7 fold in kidney. The fraction of cells in S-phase that will divide again declined approximately 10 fold with age. Concurrently, average cell area increased approximately 2 fold. The findings suggest that somatic growth deceleration primarily results not from an increase in cell-cycle time but from a decrease in growth fraction (fraction of cells that continue to proliferate). During the deceleration phase, cells appear to reach a proliferative limit and undergo their final cell divisions, staggered over time. Concomitantly, cells enlarge to a greater volume, perhaps because they are relieved of the size constraint imposed by cell division. In conclusion, a decline in growth fraction with age causes somatic growth deceleration and thus sets a fundamental limit on adult body size.


Figures

Figure 1
Figure 1. Identification of labeled nuclei
Mice received injections of 3H-thymidine and BrdU at different time points. Incorporation of label occurs if a cell is in S-phase at the time of that injection or shortly thereafter. Autoradiography was used to visualize cells that incorporated 3H-thymidine, which are identified by the presence of grains over the nucleus (A), and immunohistochemistry was used to detect cells that had incorporated BrdU, seen as brown-stained nuclei (B). Double-labeled nuclei show both grains and brown staining (C). 1000× magnification, bar = 5µm.
Figure 2
Figure 2. 3H-thymidine labeling index (HLI) (mean ± SEM)
Mice received an injection of 3H-thymidine at age 7, 14, or 21 days to label cells in S-phase. Tubular epithelial cells in the renal cortex (A) and hepatocytes (B) were evaluated for 3H-thymidine labeling. The HLI was calculated by dividing the number of 3H-thymidine-labeled nuclei counted by the total number of nuclei. (* P = 0.002; ** P < 0.001)
Figure 3
Figure 3. BrdU labeling index (BLI) (mean ± SEM)
Mice received one or more injections of BrdU at age 8, 9, 10–11, 12–14, 15–21, 22–28, or 29–35 days to label cells in S-phase. BrdU labeling was evaluated in tubular epithelial cells in the renal cortex (A, P < 0.001 ANOVA) and in hepatocytes (B, P < 0.001 ANOVA). The BLI was calculated by dividing the number of BrdU-labeled nuclei by the total number of nuclei. For tubular epithelial cells, a significant decrease was present only after 14 days (P < 0.05 for all pairwise comparisons between each of the first 4 time points and each of the last 3 time points).
Figure 4
Figure 4. Double-labeling index (DLI)
Mice received an initial injection of 3H-thymidine followed by one or more injections of BrdU at various time points ranging from 1 to 28 days later. Tubular epithelial cells in the renal cortex (A) and hepatocytes (B) were evaluated for double labeling. [black bars] = 1-week-old mice, [white bars] = 2-week-old mice, and [gray bars] = 3-week-old mice. The DLI was calculated by dividing the average number of double-labeled cells by the number of BrdU injections and by the number of 3H-thymidine-labeled cells in mice killed on day 2. This value was adjusted mathematically to account for organ growth between the 3H-thymidine and BrdU injections. The presence of both labels in a cell indicated that the cell was in S-phase during the initial injection and had returned to S-phase at the time of the subsequent injection; thus, the time between the injections is equal to the cell-cycle time.
Figure 5
Figure 5. Mean cell-cycle time
The mean cell-cycle time at each age was calculated from the DLI data for tubular epithelial cells in the renal cortex (A, P < 0.001) and for hepatocytes (B, P = NS).
Figure 6
Figure 6. Area under double-labeling index curve (mean ± SEM)
This measurement was calculated for each age from the DLI data for tubular epithelial cells in the renal cortex (A, P < 0.001) and for hepatocytes (B, P = 0.001). The area under the DLI curve is proportional to the percentage of cells dividing at t = 0 that will divide again in the next four weeks.
Figure 7
Figure 7. Cross-sectional area per cell (mean ± SEM)
The area of a region was divided by the number of nuclei to obtain the area occupied by each cell. This value includes both the average intracellular and extracellular area per cell. Linear regression analysis was used to determine whether the mean area occupied per cell changed significantly with age. A significant increase was observed for both renal tubular epithelial cells (A, P < 0.001) and hepatocytes (B, P < 0.001).

Similar articles

Cited by

References

    1. Goedbloed JF. The embryonic and postnatal growth of rat and mouse. I. The embryonic and early postnatal growth of the whole embryo. A model with exponential growth and sudden changes in growth rate. Acta Anat (Basel) 1972;82:305–306. - PubMed
    1. Hughes PC, Tanner JM. A longitudinal study of the growth of the black-hooded rat: methods of measurement and rates of growth for skull, limbs, pelvis, nose-rump and tail lengths. J Anat. 1970;106:349–370. - PMC - PubMed
    1. Tanner JM, Davies PS. Clinical longitudinal standards for height and height velocity for North American children. J Pediatr. 1985;107:317–329. - PubMed
    1. Rose SR, Municchi G, Barnes KM, Kamp GA, Uriarte MM, Ross JL, Cassorla F, Cutler GB., Jr Spontaneous growth hormone secretion increases during puberty in normal girls and boys. J Clin Endocrinol Metab. 1991;73:428–435. - PubMed
    1. Juul A, Holm K, Kastrup KW, Pedersen SA, Michaelsen KF, Scheike T, Rasmussen S, Muller J, Skakkebaek NE. Free insulin-like growth factor I serum levels in 1430 healthy children and adults, and its diagnostic value in patients suspected of growth hormone deficiency. J Clin Endocrinol Metab. 1997;82:2497–2502. - PubMed

Publication types