. 2008 Jul;118(7):2526-34.
doi: 10.1172/JCI33293.

Succinate receptor GPR91 provides a direct link between high glucose levels and renin release in murine and rabbit kidney

Affiliations

Succinate receptor GPR91 provides a direct link between high glucose levels and renin release in murine and rabbit kidney

Ildikó Toma et al. J Clin Invest. 2008 Jul.

Abstract

Diabetes mellitus is the most common and rapidly growing cause of end-stage renal disease in developed countries. A classic hallmark of early diabetes mellitus includes activation of the renin-angiotensin system (RAS), which may lead to hypertension and renal tissue injury, but the mechanism of RAS activation is elusive. Here we identified a paracrine signaling pathway in the kidney in which high levels of glucose directly triggered the release of the prohypertensive hormone renin. The signaling cascade involved the local accumulation of succinate and activation of the kidney-specific G protein-coupled metabolic receptor, GPR91, in the glomerular endothelium as observed in rat, mouse, and rabbit kidney sections. Elements of signal transduction included endothelial Ca2+, the production of NO and prostaglandin (PGE2), and their paracrine actions on adjacent renin-producing cells. This GPR91 signaling cascade may serve to modulate kidney function and help remove metabolic waste products through renal hyperfiltration, and it could also link metabolic diseases, such as diabetes, or metabolic syndrome with RAS overactivation, systemic hypertension, and organ injury.


Figures
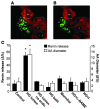
Figure 1
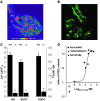
Figure 1. Direct and acute effects of high glucose level on the JGA.
(A and B) Real-time confocal fluorescence imaging of renin content (quinacrine, green) and vascular diameter (cell membranes are labeled with R-18, red) in the in vitro microperfused terminal afferent arteriole (AA) with attached glomerulus (G) freshly isolated from rabbit kidney. In response to increasing glucose concentration of the afferent arteriole perfusate from 5.5 mM (control, A) to 25.5 mM (high glucose level, B), a significant number of renin granules in JG cells (JG) released their fluorescent content and the afferent arteriole internal diameter (arrows) increased. Scale bar: 20 μm. (C) Normalized reductions in quinacrine fluorescence (as an index of renin release) and increases in afferent arteriole diameter within 30 minutes of high glucose level (HG) application. Blockade of NO synthases (L-NAME; 1 mM) and cyclooxygenases ([I] indomethacin; 50 μM) inhibited the effects of high glucose level, indicating involvement of NO and prostaglandins, respectively. Removing the endothelium (endo) or bath glucose had no effect, and equimolar mannitol caused only minor renin release. *P < 0.01; n = 6 each.
Figure 2
Figure 2. Effects of TCA cycle intermediates and inhibitors on renin release.
(A) Overview of the TCA cycle and sites of inhibition with fluorocitrate (F; 100 μM; blocks aconitase in step 2) and malonate (MAL; 1 mM; blocks succinate dehydrogenase in step 6). (B) Effects of TCA cycle inhibitors on renin release in presence of normal (5.5 mM when not indicated) or high glucose (25.5 mM), or succinate (SUCC, 5 mM) levels. C, control. *P < 0.001, control vs. high glucose, high glucose plus succinate, succinate, and malonate. **P < 0.001 malonate alone vs. malonate plus high glucose, and malonate plus succinate. n = 6 each. (C) Dose-dependent effects of succinate and malonate on in vitro renin release. n = 6 measurements for each dose. (D) Representative recordings of changes in quinacrine fluorescence intensity (renin release) in control and in response to high glucose and succinate levels (black lines), and the time course of the high glucose level–induced afferent arteriole vasodilatation (gray line).
Figure 3
Figure 3. Succinate accumulation in diabetic kidney tissue and urine.
An enzyme assay and freshly harvested urine and whole kidney homogenates were used to estimate succinate accumulation in control (n = 5) versus diabetic (DM; 1 week after STZ treatment; n = 6) GPR91 WT mouse kidneys. Individual samples were measured in triplicates and averaged. *P < 0.001 control vs. diabetic.
Figure 4
Figure 4. High glucose level–induced renin release in GPR91+/+ and GPR91–/– mice.
Effects of high glucose level (25.5 mM) on renin release, measured by the reduction in quinacrine fluorescence. Hyperosmotic control using mannitol is also shown (same data as in Figure 1C). C, control baseline renin release. GPR91+/+ (WT, n = 6) and GPR91–/– (KO, n = 4) mice were used. *P < 0.001, control vs. high glucose lumen (rabbit, mouse).
Figure 5
Figure 5. Localization of GPR91 in GENCs.
(A) Representative RT-PCR demonstrating the presence/absence of GPR91 in various mouse kidney cell types. C, control mix with no cDNA; WK, whole kidney from WT GPR91+/+ or KO GPR91–/– mice. Same results were obtained in n = 6 different samples each. JGC, renin-producing JG cells. (BE) Localization of GPR91 protein in rat kidney with immunohistochemistry. (B) Strong GPR91 labeling (red) was found in vascular endothelial cells, in both terminal afferent arteriole (Aff. art.) and glomerulus. One region of the glomerulus (indicated by a rectangle) is magnified in C and D for high-resolution colocalization studies. (C) Double labeling for rat endothelial cell marker RECA-1 (green) identified the endothelium of intraglomerular capillary loops (cl). (D) Overlay of GPR91 (red) and RECA-1 (green) images shows colocalization (yellow) of the 2 proteins in the same structures. DIC background is merged with fluorescence to show glomerular morphology. (E) Negative control using no GPR91 primary antibody. Nuclei are blue. Scale bar: 10 μm (BE). (F) Elevations in GENC [Ca2+]i levels from baseline (under normal glucose [NG], 5.5 mM) in response to high glucose level (25.5 mM) and TCA cycle inhibitors and intermediates. Succinate, 5 mM; malonate, 1 mM; fluorocitrate, 100 μM. *P < 0.001, compared with NG; n = 9 each. (G) Dose-response relationship of high glucose level– and succinate-induced elevations in GENC Ca2+ levels; n = 6 each. F/F0, fluorescence (F) normalized to baseline (F0). (H) Cell- and GPR91-specificity of the succinate-induced [Ca2+]i response. HEK cells were used for biosensor experiments (see below). *P < 0.001, compared with baseline; n = 6 each. Cells were grown on coverslips to near confluency, loaded with Ca2+ sensitive fluorescent dye fura-2, and [Ca2+]i was measured using a cuvette-based spectrofluorometer (Quantamaster-8; Photon Technology Inc.).
Figure 6
Figure 6. GPR91 signaling in the vascular endothelium.
Succinate- and GPR91-induced endothelial cytosolic Ca2+ [Ca2+]i signaling and NO production were studied using the microperfused mouse afferent arteriole–attached glomerulus preparation and confocal fluorescence microscopy with fluo-4/fura red ratiometric Ca2+ (A) and DAF-FM imaging (B), respectively. Arrows point at glomerulus and afferent arteriole endothelial cells in situ. Scale bar: 20 μm. (C) Summary of the high glucose– (25.5 mM) and succinate- (5 mM) induced normalized changes in endothelial [Ca2+]i and NO production in WT GPR91+/+ or KO GPR91–/– kidney tissue. *P < 0.05, WT (+/+) vs. KO (–/–); n = 6 each. (D) Dose-response relationship of succinate-induced elevations in PGE2 production and release from cultured GENCs, measured using a PGE2 biosensor. Specially engineered biosensor cells, HEK293 cells, expressing the Ca2+-coupled PGE2 receptor EP1 were loaded with fluo-4 and positioned next to GENCs in culture. Effects of succinate on GENC PGE2 production were measured based on the biosensor cell Ca2+ signal, since upon PGE2-binding these biosensor cells produce a Ca2+ response detected by fluorescence imaging. The cyclooxygenase inhibitor indomethacin (50 μM) and EP1 receptor blocker SC-51322 (10 μM) in presence of 5-mM succinate both served as negative controls for PGE2 specificity. Normalized changes in HEK293-EP1 biosensor cell fluo-4 intensity are shown and served as an index of PGE2 release. n = 6 for each dose.
Figure 7
Figure 7. Renin granular content in GPR91+/+ and GPR91–/– mice in vivo.
(A and B) Representative multiphoton fluorescence images of JGA renin content (green) in nondiabetic (A and B) and diabetic (C and D) GPR91+/+ (A and C) and GPR91–/– (B and D) mouse kidneys. The intravascular space (plasma) was labeled using a 70-kDa dextran rhodamine conjugate (red). Scale bar: 20 μm. (E) Summary of changes in JGA renin content in control and in the STZ model of type 1 diabetes (STZ-diabetic; DM) GPR91+/+ and GPR91–/– mice. JGA renin content was calculated based on measuring the area of quinacrine fluorescence (μm2).*P < 0.05, C vs. DM GPR91+/+; ΧP < 0.05, C GPR91+/+ vs. C GPR91–/–; #P < 0.05, DM GPR91+/+ vs. DM GPR91–/– (n = 4 each). (F) Renin immunoblot (green) using control and STZ-diabetic GPR91+/+ and GPR91–/– mouse whole kidney. Four samples are shown for each group. β-actin (red) served as loading control. (G) Summary of changes in whole kidney renin content based on renin immunoblot densitometry. *P < 0.05 C vs. DM GPR91+/+; #P < 0.05 DM GPR91+/+ vs. DM GPR91–/– (n = 4 each).
Figure 8
Figure 8. Changes in whole kidney and serum prorenin content in control and STZ-diabetic GPR91+/+ and GPR91–/– mice.
Prorenin was measured in whole kidney homogenates and serum as the difference between renin activity before and after trypsin activation of prorenin measured with a fluorescence renin enzyme essay. Compared to age-matched nondiabetic control animals, prorenin content of both whole kidney tissue and plasma samples increased significantly in diabetic animals. Diabetic GPR91–/– animals showed no change in kidney or serum prorenin content. *P < 0.05, C vs. DM GPR91+/+; #P < 0.05, DM GPR91+/+ vs. DM GPR91–/– (n = 4 each).

References

    1. Ritz E., Dikow R. Hypertension and antihypertensive treatment of diabetic nephropathy. Nat. Clin. Pract. Nephrol. 2006;2:562–567. - PubMed
    1. Gurley S.B., Coffman T.M. The renin-angiotensin system and diabetic nephropathy. Semin. Nephrol. 2007;27:144–152. doi: 10.1016/j.semnephrol.2007.01.009. - DOI - PubMed
    1. Thomson S.C., et al. Ornithine decarboxylase, kidney size, and the tubular hypothesis of glomerular hyperfiltration in experimental diabetes. J. Clin. Invest. 2001;107:217–224. doi: 10.1172/JCI10963. - DOI - PMC - PubMed
    1. He W., et al. Citric acid cycle intermediates as ligands for orphan G-protein-coupled receptors. Nature. 2004;429:188–193. doi: 10.1038/nature02488. - DOI - PubMed
    1. Hebert S.C. Physiology: Orphan detectors of metabolism. Nature. 2004;429:143–145. doi: 10.1038/429143a. - DOI - PubMed

Publication types

MeSH terms