. 2008 Jul;118(7):2459-70.
doi: 10.1172/JCI33569.

Hip1r is expressed in gastric parietal cells and is required for tubulovesicle formation and cell survival in mice

Affiliations

Hip1r is expressed in gastric parietal cells and is required for tubulovesicle formation and cell survival in mice

Renu N Jain et al. J Clin Invest. 2008 Jul.

Abstract

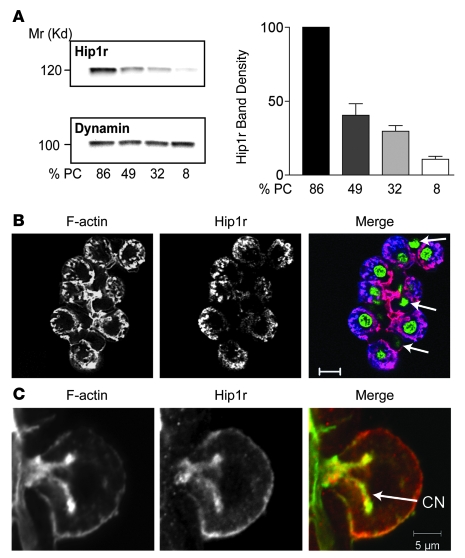
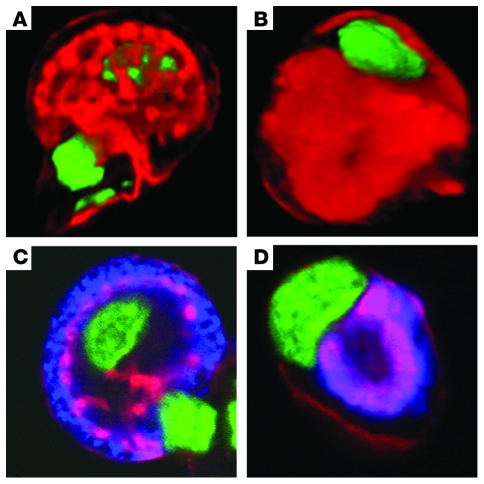
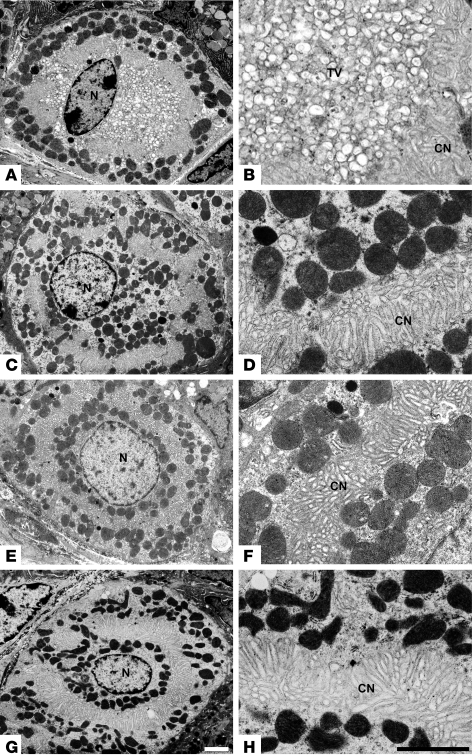
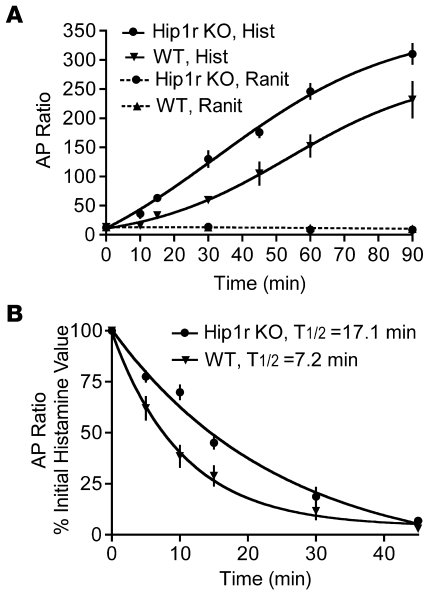
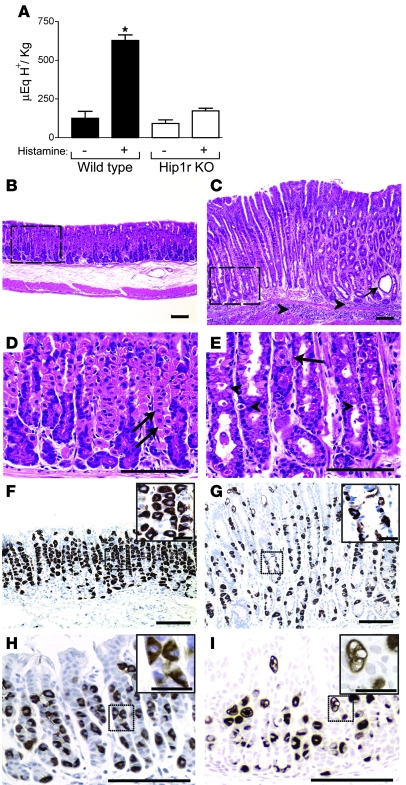
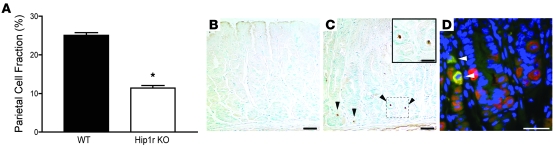
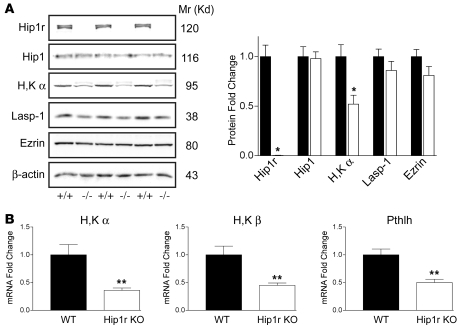
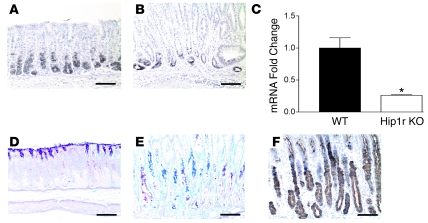
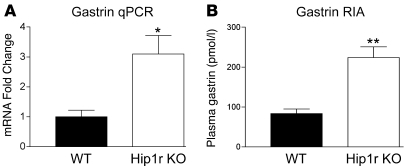
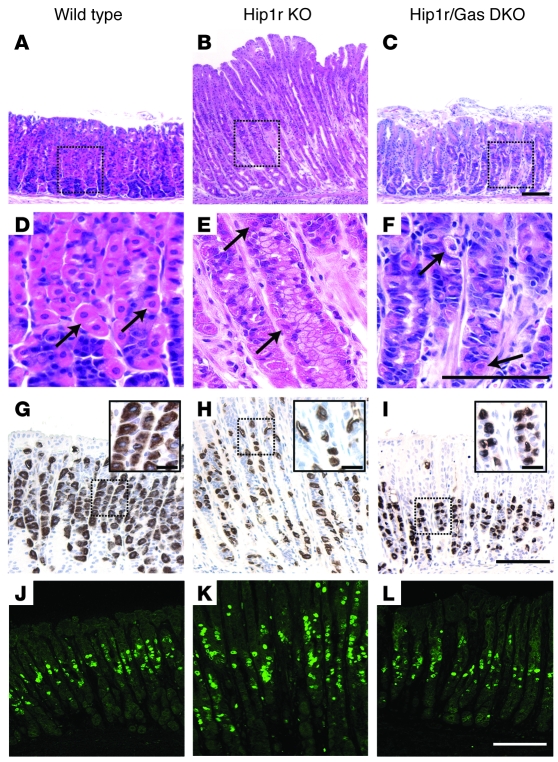
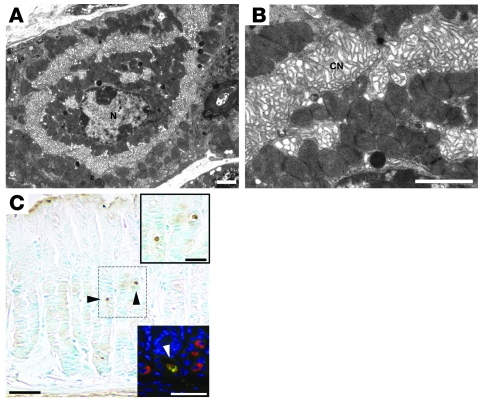
Huntingtin interacting protein 1 related (Hip1r) is an F-actin- and clathrin-binding protein involved in vesicular trafficking. In this study, we demonstrate that Hip1r is abundantly expressed in the gastric parietal cell, predominantly localizing with F-actin to canalicular membranes. Hip1r may provide a critical function in vivo, as demonstrated by extensive changes to parietal cells and the gastric epithelium in Hip1r-deficient mice. Electron microscopy revealed abnormal apical canalicular membranes and loss of tubulovesicles in mutant parietal cells, suggesting that Hip1r is necessary for the normal trafficking of these secretory membranes. Accordingly, acid secretory dynamics were altered in mutant parietal cells, with enhanced activation and acid trapping, as measured in isolated gastric glands. At the whole-organ level, gastric acidity was reduced in Hip1r-deficient mice, and the gastric mucosa was grossly transformed, with fewer parietal cells due to enhanced apoptotic cell death and glandular hypertrophy associated with cellular transformation. Hip1r-deficient mice had increased expression of the gastric growth factor gastrin, and mice mutant for both gastrin and Hip1r exhibited normalization of both proliferation and gland height. Taken together, these studies demonstrate that Hip1r plays a significant role in gastric physiology, mucosal architecture, and secretory membrane dynamics in parietal cells.


Figures

Figure 1
Figure 1. Hip1r is highly expressed in parietal cells, colocalizing with F-actin on the apical canalicular membrane.
(A) Rabbit gastric mucosal cells were dispersed and fractionated by density gradient centrifugation, with parietal cell representation (%PC) in each fraction determined by H+, K+-ATPase immunostaining. Shown are representative Western blots of gastric cell fractions that were sequentially probed for Hip1r and dynamin, a protein ubiquitously expressed in gastric mucosal cells. Quantitation from 3 blots in which independent parietal cell enriched/depleted fractions were analyzed is shown. Data (mean ± SEM) are shown as band density, normalized to dynamin, relative to expression in the fraction containing the highest proportion of parietal cells. (B) Mouse gastric glands isolated from 3-month-old WT mice were costained for F-actin (red) and Hip1r (blue). Nuclei were visualized with SYTOX green. Shown is 1 gland with numerous parietal cells, demonstrating substantial coincidence of Hip1r and F-actin. Arrows denote nuclei of nonparietal cells, which did not stain with the Hip1r antibody. (C) Single parietal cell from a rabbit gastric gland preparation costained for F-actin (green) and Hip1r (red). Note their close correspondence in the apical canalicular and basolateral membranes. CN, canalicular network. Scale bars: 10 μm (B); 5 μm (C).
Figure 2
Figure 2. Abnormal canalicular structure in parietal cells from Hip1r-deficient mice.
Canalicular membranes in 3-month-old WT (A and C) and Hip1r-deficient (B and D) mouse gastric gland preparations. Nuclei were visualized with SYTOX green. (A and B) Three-dimensional confocal reconstructions from single parietal cells, visualized by staining for F-actin (red). (C and D) Confocal sections from single parietal cells, visualized by costaining for F-actin (red) and H+, K+-ATPase α subunit (blue).
Figure 3
Figure 3. Parietal cells from Hip1r-deficient mice do not contain tubulovesicles.
Transmission EM was used to examine parietal cell ultrastructure in 2-month-old WT (AD) and Hip1r-deficient (EH) mice. Mice were fasted overnight, with or without histamine treatment to stimulate acid, and tissues were processed to assess resting (A, B, E, and F) and stimulated (C, D, G, and H) vesicular structure. Note the absence of tubulovesicles in resting Hip1r-deficient cells (E and F), which is similar to stimulated WT cells (C and D). TV, tubulovesicles; N, nucleus. Scale bars: 2 μm (white, A, C, E, and G; black, B, D, F, and H).
Figure 4
Figure 4. Time course for activation and inhibition of [14C]-AP accumulation in gastric glands isolated from 3-month-old WT and Hip1r-deficient mice.
(A) Glands were stimulated with 10 μM histamine (Hist) or incubated with 50 μM ranitidine (Ranit), and samples were taken at the indicated times. The ratios of [14C]-AP accumulated in glands versus extracellular medium are shown as mean ± SEM. n = 8–10 mice per each of 4 experiments. (B) Glands were stimulated with 10 μM histamine for 60 min, 50 μm ranitidine was added, and samples were taken at the indicated times thereafter to measure the decay in [14C]-AP retention. Values (mean ± SEM) are shown as percent of the initial histamine-stimulated value. n = 8–10 mice per each of 3–4 experiments.
Figure 5
Figure 5. Reduced acid secretion and gross histological changes in Hip1r-deficient mouse stomach.
(A) Acid content from the stomachs of 2- to 4-month-old WT and Hip1r-deficient mice. Values (mean ± SEM) were normalized to body wt. Mice were fasted (n = 6 per genotype) or treated with histamine (n = 3 per genotype) to measure basal and stimulated acid contents, respectively. *P < 0.005 versus unstimulated WT. (BG) Histological analysis of gastric paraffin sections from 2-month-old WT (B, D, and F) and Hip1r-deficient (C, E, and G) mice after H&E staining (BE) or H+, K+-ATPase immunostaining (F and G). H&E staining revealed a hypertrophic mucosa in Hip1r-deficient mice with cystic structures (C, arrow) and inflammatory cell infiltrates (C, arrowheads). (D and E) Higher-magnification views of boxed regions in B and C, respectively, demonstrate the marked cellular changes in Hip1r-deficient mice, including numerous delaminated cells (E, arrowheads). In comparison to the abundant parietal cells (arrows) in WT mice, only 1 recognizable parietal cell was seen in Hip1r-deficient mice. (F and G) Sections stained for parietal cells with a mAb to the α subunit of H+, K+-ATPase. Insets show higher-magnification images of boxed regions. (H and I) Similar analysis of 3-week-old WT (H) and Hip1r-deficient (I) mice by H+, K+-ATPase immunostaining demonstrated parietal cell abnormalities in young mice. Scale bars: 100 μm (BI); 20 μm (FI, insets).
Figure 6
Figure 6. Decreased parietal cell number and increased parietal cell apoptosis in Hip1r-deficient mice.
(A) Parietal cells (H+, K+-ATPase positive) were measured as a proportion of total oxyntic epithelial cells (keratin positive) in 2-month-old WT and Hip1r-deficient mice by flow cytometry. Data (mean ± SEM) are shown as percent parietal cell fraction. n = 3. *P < 0.0001 versus WT. (B and C) TUNEL staining in 2-month-old WT (B) and Hip1r-deficient (C) mice. TUNEL-positive cells (arrowheads) were only observed in the mutant. (C, inset) Magnified view of the boxed region with 2 apoptotic cells. (D) Costaining for activated caspase-3 (green) and H+, K+-ATPase (red) in 2-month-old Hip1r-deficient stomach showed that the apoptotic cells were parietal cells (arrowheads). Scale bars: 40 μm (B and C); 20 μm (C, inset, and D).
Figure 7
Figure 7. Reduced expression of parietal cell markers in Hip1r-deficient mouse stomach.
(A) Western blot analysis of protein extracts from mucosal scrapings of gastric corpus from 3-month-old WT (+/+) and Hip1r-deficient (–/–) mice. Extracts were subjected to SDS gel electrophoresis, and blots were probed with Abs to Hip1r; Hip1; H+, K+-ATPase α (H,K α); Lasp-1; ezrin; and β-actin. Quantitative measurement of the signal strength from extracts prepared from 3 different WT (black bars) and Hip1r-deficient (white bars) mice are shown as fold change relative to WT and normalized to β-actin as a loading control. Data are mean ± SEM. (B) qRT-PCR analysis was used to measure parietal cell transcripts (H+, K+-ATPase α, H+, K+-ATPase β, and parathyroid hormone–like hormone [Pthlh]) in RNA samples isolated from the corpus of 6-month-old WT and Hip1r-deficient mice. Data (mean ± SEM) were normalized to Gapdh expression in the same samples and reported as fold change relative to WT. n = 3. *P < 0.05, **P < 0.03 versus WT.
Figure 8
Figure 8. Loss of chief cells and expansion of an aberrant mucous neck cell population in Hip1r-deficient stomach.
(A and B) Chief cells in 2-month-old WT (A) and Hip1r-deficient (B) mice were identified by immunostaining paraffin sections with a polyclonal antibody to intrinsic factor. (C) Intrinsic factor mRNA abundance was determined by qRT-PCR analysis of RNA samples isolated from the corpus of 6-month-old WT and Hip1r-deficient mice. Data (mean ± SEM) were normalized to Gapdh expression in the same samples and reported as fold change relative to WT. n = 3. *P = 0.01 versus WT. (DF) Expansion of aberrant mucous neck cells in Hip1r-deficient mice. Paraffin sections from 2-month-old WT (D) and Hip1r-deficient (E and F) mice were stained with PAS/Alcian blue (D and E) for neutral (pink) or acidic (blue) mucus or with GSII (F) to identify mucous neck cells. Scale bars: 100 μm.
Figure 9
Figure 9. Hip1r-deficient mice are hypergastrinemic.
(A) Gastrin transcript abundance was determined by qRT-PCR analysis of gastric antral RNA samples from 6-month-old WT and Hip1r-deficient mice. Data (mean ± SEM) were normalized to Gapdh expression in the same samples and reported as fold change relative to WT. n = 3. (B) Plasma gastrin levels were measured in 2- to 6-month-old mice by RIA in WT and Hip1r-deficient mice (n = 8–10). *P < 0.05, **P = 0.0001 versus WT.
Figure 10
Figure 10. Gastric hypertrophy and hyperproliferation in Hip1r-deficient mice are gastrin dependent.
Histological analysis of gastric paraffin sections from 2-month-old WT (A, D, G, and J), Hip1r-deficient (B, E, H, and K), and Hip1r and gastrin double knockout (DKO; C, F, I, and L) mice. (AC) H&E-stained paraffin sections showed a normalization of gland height when the Hip1r mutation was on a gastrin-deficient strain background. (DF) Magnified view of boxed regions in H&E-stained sections with parietal cells (arrows). (GI) Immunostaining for H+, K+-ATPase. Insets are magnified views of boxed regions to show parietal cell morphology. (JL) Ki67 immunostaining of paraffin sections showed normalization of proliferation when the Hip1r mutation was on a gastrin-deficient background. Scale bars: 50 μm (AL); 10 μm (GI, insets).
Figure 11
Figure 11. Abnormal parietal cell morphology and apoptosis in 2-month-old Hip1r and gastrin double-mutant mice.
(A and B) Transmission EM demonstrated a lack of tubulovesicles in unstimulated double-mutant parietal cells. The morphology was similar to the Hip1r mutant (compare with Figure 3, E and F). (C) TUNEL staining revealed apoptotic cells in the Hip1r and gastrin double-mutant stomach mucosa. Top inset: Magnified view of the boxed region with 2 apoptotic cells (arrowheads in C). Bottom inset: Magnified view of a section costained for activated caspase-3 (green) and H+, K+-ATPase (red) to demonstrate parietal cell apoptosis. Scale bars: 2 μm (A and B); 40 μm (C); 20 μm (C, insets).

References

    1. Holtzman D.A., Yang S., Drubin D.G. Synthetic-lethal interactions identify two novel genes, SLA1 and SLA2, that control membrane cytoskeleton assembly in Saccharomyces cerevisiae. J. Cell Biol. 1993;122:635–644. doi: 10.1083/jcb.122.3.635. - DOI - PMC - PubMed
    1. Wesp A., et al. End4p/Sla2p interacts with actin-associated proteins for endocytosis in Saccharomyces cerevisiae. Mol. Biol. Cell. 1997;8:2291–2306. - PMC - PubMed
    1. Engqvist-Goldstein A.E., et al. The actin-binding protein Hip1R associates with clathrin during early stages of endocytosis and promotes clathrin assembly in vitro. J. Cell Biol. 2001;154:1209–1223. doi: 10.1083/jcb.200106089. - DOI - PMC - PubMed
    1. Legendre-Guillemin V., et al. HIP1 and HIP12 display differential binding to F-actin, AP2, and clathrin. Identification of a novel interaction with clathrin light chain. J. Biol. Chem. 2002;277:19897–19904. doi: 10.1074/jbc.M112310200. - DOI - PubMed
    1. Carreno S., Engqvist-Goldstein A.E., Zhang C.X., McDonald K.L., Drubin D.G. Actin dynamics coupled to clathrin-coated vesicle formation at the trans-Golgi network. J. Cell Biol. 2004;165:781–788. doi: 10.1083/jcb.200403120. - DOI - PMC - PubMed

Publication types

MeSH terms