Review
. 2008 Jun;26(6):659-67.
doi: 10.1038/nbt1401.

The growing scope of applications of genome-scale metabolic reconstructions using Escherichia coli

Affiliations
Review

The growing scope of applications of genome-scale metabolic reconstructions using Escherichia coli

Adam M Feist et al. Nat Biotechnol. 2008 Jun.

Abstract

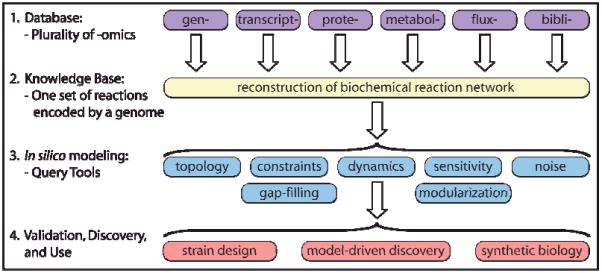
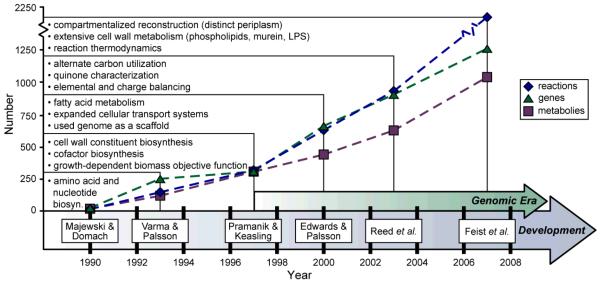
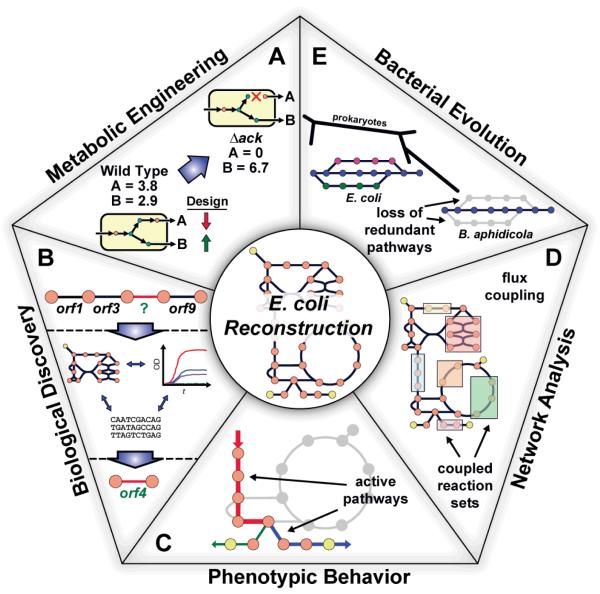
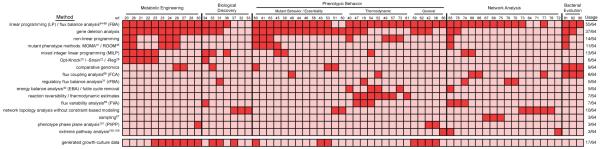
The number and scope of methods developed to interrogate and use metabolic network reconstructions has significantly expanded over the past 15 years. In particular, Escherichia coli metabolic network reconstruction has reached the genome scale and been utilized to address a broad spectrum of basic and practical applications in five main categories: metabolic engineering, model-directed discovery, interpretations of phenotypic screens, analysis of network properties and studies of evolutionary processes. Spurred on by these accomplishments, the field is expected to move forward and further broaden the scope and content of network reconstructions, develop new and novel in silico analysis tools, and expand in adaptation to uses of proximal and distal causation in biology. Taken together, these efforts will solidify a mechanistic genotype-phenotype relationship for microbial metabolism.


Figures

Figure 1
Figure 1. Formulation and use of GEMs as a four-step process
Formulation and use of GEMs as a four-step process. Step 1, the process is based on a variety of high-throughput data sets (i.e., omics data) and a comprehensive assessment of the literature (i.e., bibliomic data). Step 2, all of the data types are used to reconstruct the list of biochemical transformations that make up a network as well as their genetic basis. In principal, the network is unique. Step 3, the data contained in the reconstruction can be formally represented (i.e., in the form of matrices and logical statements) that can be mathematically characterized by a variety of methods. Step 4, the computational model enables a broad spectrum of applications, as reviewed in this article. Figure adapted from
Figure 2
Figure 2. The ongoing reconstruction of the E. coli metabolic network
History of the E. coli metabolic reconstruction. Shown are six milestone efforts contributing to the reconstruction of the E. coli metabolic network. For each of the six reconstructions -, the number of included reactions (blue diamonds), genes (green triangles) and metabolites (purple squares) are displayed. Also listed are noteworthy properties that each successive reconstruction provided over previous efforts. For example, Varma & Palsson, included amino acid and nucleotide biosynthesis pathways in addition to the content that Majewski & Domach characterized. The start of the genomic era (1997) marked a significant increase in included reconstruction components for each successive iteration. The reaction, gene and metabolite values for pre-genomic era reconstructions were estimated from the content outlined in each publication and in some cases, encoding genes for reactions were unclear.
Figure 3
Figure 3. Applications of the Genome-Scale Model (GEM) of E. coli
Uses of the E. coli reconstructions divided into five categories. (A) A drawing of a predicted effect from a loss of function mutation in a simple system is shown. Metabolic engineering studies have investigated in silico strain design using E. coli metabolic reconstructions to overproduce desired products-. (B) Recent studies utilizing the reconstruction in a prospective manner have aimed to use the current biochemical and genetic information included in the metabolic network along with additional data types to drive biological discovery, such as predicting genes encoding for orphan reactions, , -. (C) Utilizing the reconstruction in phenotypic studies, computational analyses have examined gene, , , , , metabolite, and reaction, , , essentiality along with considering thermodynamics, , , , , , , , to make better predictions about the physiological state (i.e., the active pathways) of the cell for a given environmental condition. (D) The E. coli reconstructions have been used to analyze and interpret the intrinsic properties of biological networks. One example being finding coupled reaction activities (as shown in the drawing) across different growth conditions. (E) Using the network reconstruction, evolutionary studies have examined the cellular network in the context of adaptive evolution events, horizontal gene transfer, and minimal metabolic network evolution (as shown in the drawing).
Figure 4
Figure 4. Summary of the in silico methods utilized in published E. coli GEM studies
This heatmap characterizes the incorporation of different computational methods into studies utilizing genome-scale models of E. coli. A dark box indicates that a particular method (one method per row) was utilized in a corresponding study (one citation per column); the frequency of usage of a particular method is given on the right. Studies were grouped into one of five general categories and studies examining phenotypic behavior were further divided into three subgroups. Studies that contributed new experimental growth data are also marked along the bottom offset row.
Figure 5
Figure 5. Comparison of computation and experimental data: identification of agreements and disagreements
The comparison of GEM computation and organism-specific experimental measurements identifies agreements and disagreements. The phenotypic outcomes are tabulated for genetic perturbations examined in a given environment (e.g., growth or no growth). A ‘+’ indicates that a given phenotype is not affected by the perturbation, and ‘−’ indicates it does. Each outcome of comparison has a different implication; 1: consistency check - a perturbation has no affect on the property being measured and modeling predicts the same; 4: validation - the perturbation affects the experimental outcome and modeling with the GEM predicts this outcome; 2: identification of missing content - when GEM modeling fails to predict the positive confirmation of the property being measured, this outcome indicates that there is missing content in the GEM and can lead to the identification of specific areas for biological discovery; 3: identification of errors, inconsistencies or missing context-specific information – a positive prediction for the measured property and an opposite experimental observation indicates a possible error in the current organism-specific knowledge or that additional context-specific information is lacking from the GEM or modeling method (e.g., transcriptional regulation).

References

    1. Reed JL, Famili I, Thiele I, Palsson BO. Towards multidimensional genome annotation. Nat Rev Genet. 2006;7:130–141. - PubMed
    1. Palsson BO. Systems biology: properties of reconstructed networks. Cambridge University Press; New York: 2006.
    1. Price ND, Reed JL, Palsson BO. Genome-scale models of microbial cells: evaluating the consequences of constraints. Nat Rev Microbiol. 2004;2:886–897. - PubMed
    1. Frazier ME, Johnson GM, Thomassen DG, Oliver CE, Patrinos A. Realizing the potential of the Genome Revolution: The Genomes to life Program. Science. 2003;300:290–293. - PubMed
    1. Reed JL, Palsson BO. Thirteen Years of Building Constraint-Based In Silico Models of Escherichia coli. J Bacteriol. 2003;185:2692–2699. - PMC - PubMed

Publication types

MeSH terms