. 2008 Jul;11(7):799-806.
doi: 10.1038/nn.2135. Epub 2008 Jun 8.

Evolutionary expansion and anatomical specialization of synapse proteome complexity

Affiliations

Evolutionary expansion and anatomical specialization of synapse proteome complexity

Richard D Emes et al. Nat Neurosci. 2008 Jul.

Abstract

Understanding the origins and evolution of synapses may provide insight into species diversity and the organization of the brain. Using comparative proteomics and genomics, we examined the evolution of the postsynaptic density (PSD) and membrane-associated guanylate kinase (MAGUK)-associated signaling complexes (MASCs) that underlie learning and memory. PSD and MASC orthologs found in yeast carry out basic cellular functions to regulate protein synthesis and structural plasticity. We observed marked changes in signaling complexity at the yeast-metazoan and invertebrate-vertebrate boundaries, with an expansion of key synaptic components, notably receptors, adhesion/cytoskeletal proteins and scaffold proteins. A proteomic comparison of Drosophila and mouse MASCs revealed species-specific adaptation with greater signaling complexity in mouse. Although synaptic components were conserved amongst diverse vertebrate species, mapping mRNA and protein expression in the mouse brain showed that vertebrate-specific components preferentially contributed to differences between brain regions. We propose that the evolution of synapse complexity around a core proto-synapse has contributed to invertebrate-vertebrate differences and to brain specialization.


Figures
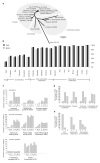
Figure 1
Figure 1. Comparison of PSD and MASC homologues and expansion of selected functional groups of genes
a) The phylogenetic relationship of species studied. Numbers in parentheses represent number of NRC/PSD orthologues detected respectively. b) The occurrence of PSD and MASC homologues found in each of the 19 species as a percentage of those found in human. Where annotation of multiple homologues was reported by Ensembl, a single positive hit was recorded. c) Evolution of learning and plasticity mechanisms. From the 651 PSD/MASC genes, the number of genes in different species (yeast (Y), worm (W), fly (F), zebrafish (Z), chicken (C), mouse (M) and human (H)) involved with 3 major molecular mechanisms (receptors, second messenger signaling, protein synthesis) of learning and memory were plotted. For clarity, only data from seven representative species are shown. Numbers in parentheses are GO term identifiers (www.geneontology.org/). Data were obtained from Ensembl. d) Upstream signaling components show increasing rates of expansion towards mammalian lineage. The proportion of each functional class (as a percentage of the total number of mouse MASC/PSD genes belonging to it) whose earliest identifiable orthologue occurs in yeast (Y), invertebrates (I) or vertebrates (V). e) Downstream signaling components show decreasing rates of expansion towards mammalian lineage. The proportion of each functional class (as a percentage of the total number of mouse MASC/PSD genes belonging to it) whose earliest identifiable orthologue occurs in yeast (Y), invertebrates (I) or vertebrates (V).
Figure 2
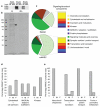
Figure 2. Proteomic analysis of the Drosophila MASC
a) DLG binds Drosophila NR2 C-terminal peptide. Protein extracts (input) of fly head were incubated with dPEP6 (d6) or dPEP6ΔVL (d6Δ) resin immobilised peptide. After binding the resin was washed (wash) and bound protein eluted (eluate) and residual bound protein (beads) were assayed for the presence of Drosophila DLG using immunoblotting. b) Eluates of dPEP6 (d6) and dPEP6ΔVL (d6Δ) columns were run on a 4-12% SDS PAGE gel and stained with coomassie brilliant blue. The arrow indicates the region on the gel which gave the majority of DLG peptides after mass spectrometry. c) Pie charts show the percentage of fMASC (220 proteins) and mMASC (186 proteins) belonging to each functional protein class. Key indicates colour code for identity of specific classes (downstream, effector components are encapsulated in the blue, purple and brown segments). d) Upstream signaling components classes showing significant expansion following divergence of fly and chordate lineages. The proportion of each functional class (as a percentage of the total number of fMASC genes belonging to it) whose earliest identifiable orthologue occurs in yeast (Y), early metazoans (M, common to fly and chordate lineages) or is fly-specific (F). e) Downstream classes are predominantly of unicellular eukaryotic origin. The proportion of each functional class (as a percentage of the total number of fMASC genes belonging to it) whose earliest identifiable orthologue occurs in yeast (Y), early metazoans (M, common to fly and chordate lineages) or is fly-specific (F).
Figure 3
Figure 3. Variation in expression patterns in mouse brain regions
a) Relative proportions of genes with variable expression patterns using four methods. This shows the percentage of genes in each AVex class, for each of the methods of testing expression. Note that genes showing no variation in expression between brain regions (AVexzero) are in the minority. The expression datasets are (clock-wise from top left): microarray (MA); western blot (WB); immunohistochemistry (IHC); and in-situ hybridisation (ISH). Expression variability classes are: AVexzero (all expression scores equal); Avexlow (scores of only 4 and 3); AVexmed (all scores between 4 and >1); and AVexhigh (scores of 4 and ≤1). b) Variation in brain expression is a function of phylogeny. The graph shows the percentage of high (black) and low (grey) variability MASC genes whose earliest identifiable orthologue was present in Yeast, an Invertebrate or Vertebrate. Note that the majority of high variability genes are of vertebrate origin, and the majority of low variability genes are of pre-metazoan origin (i.e. present in yeast). Microarray data from 22 mouse brain regions was used.
Figure 4
Figure 4. Summary of relationships of synapse proteome evolution with neuronal number, behaviour and expression patterns
a) Relationship of synapse/behavioural complexity to taxonomic grouping of species. In scatter plot of neuron number against synapse proteome complexity, estimates of neuron numbers were obtained from . Synapse proteome complexity estimated as percentage of mouse MASC/PSD components possessing orthologues. Several genes of interest to learning and plasticity are listed where they first arise. The schematic representations of signaling complexes use 3 interlinked shapes (blue circles, upstream receptor/adhesion proteins; red box, signalling proteins; yellow triangle, downstream proteins). The cell membrane is indicated as a dark line and the pre- and post-synaptic terminal is indicated for invertebrates and vertebrates. The number of blue circles and size of red box increases, illustrating their relative expansion. Behaviors indicates that while all organisms respond to their environment, ability to alter these responses and manipulate the environment show marked differences in complexity . Note expansion of mammalian brain size occurs after expansion of synapse proteome complexity. b) Mammalian MASC complexes and brain region expression variation. Schematic representation of MASC (see 4a) is shown and the expression level for 5 proteins from the 3 levels of MASC is shown (expression barcode). Upstream proteins show greater variation in expression levels and are of more recent origins. The cartoon of the brain indicates that the expression barcode is distinct for different neuronal populations.

References

    1. Kandel ER. The molecular biology of memory storage: a dialogue between genes and synapses. Science. 2001;294:1030–8. - PubMed
    1. Moore BR. The evolution of learning. Biol Rev Camb Philos Soc. 2004;79:301–35. - PubMed
    1. Roth G, Dicke U. Evolution of the brain and intelligence. Trends Cogn Sci. 2005;9:250–7. - PubMed
    1. Cuthbert PC, et al. Synapse-associated protein 102/dlgh3 couples the NMDA receptor to specific plasticity pathways and learning strategies. J Neurosci. 2007;27:2673–82. - PMC - PubMed
    1. Komiyama NH, et al. SynGAP regulates ERK/MAPK signaling, synaptic plasticity, and learning in the complex with postsynaptic density 95 and NMDA receptor. J Neurosci. 2002;22:9721–32. - PMC - PubMed

Publication types

MeSH terms