. 2008 Jul;40(7):915-20.
doi: 10.1038/ng.165. Epub 2008 Jun 8.

Bmi1 is expressed in vivo in intestinal stem cells

Affiliations

Bmi1 is expressed in vivo in intestinal stem cells

Eugenio Sangiorgi et al. Nat Genet. 2008 Jul.

Abstract

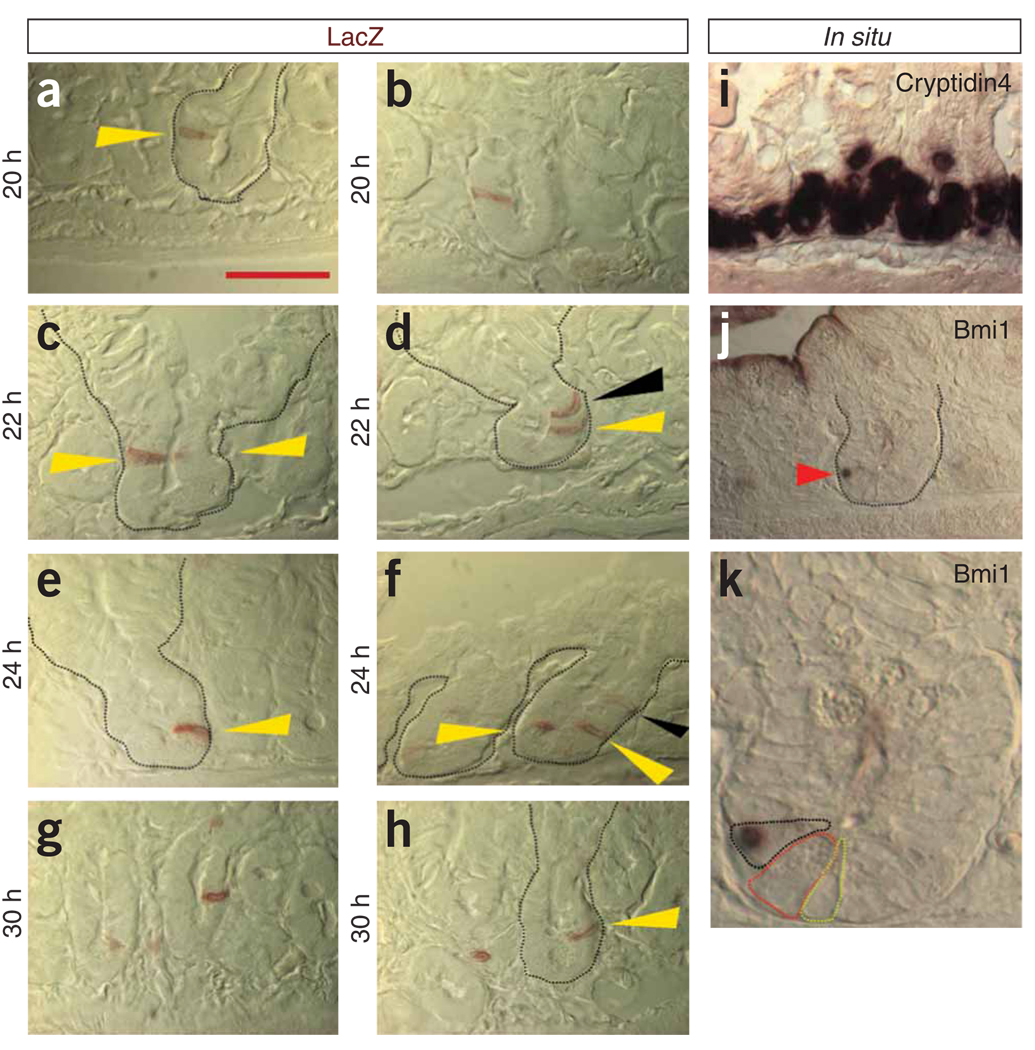
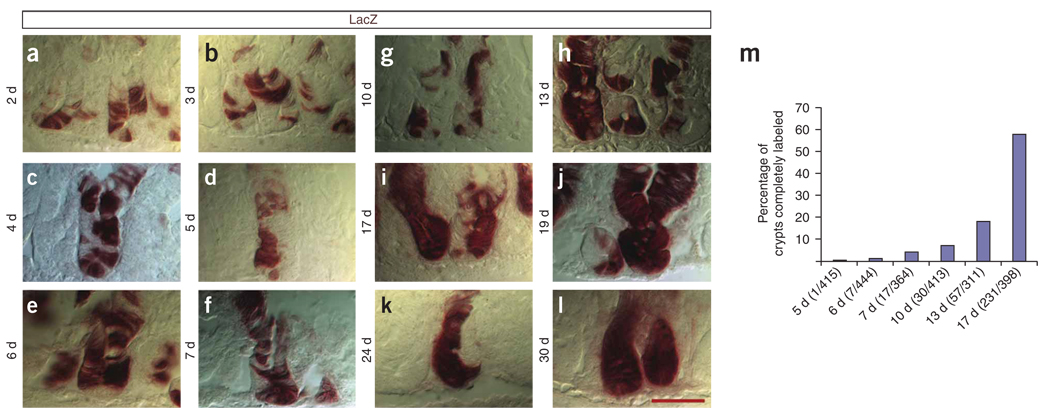
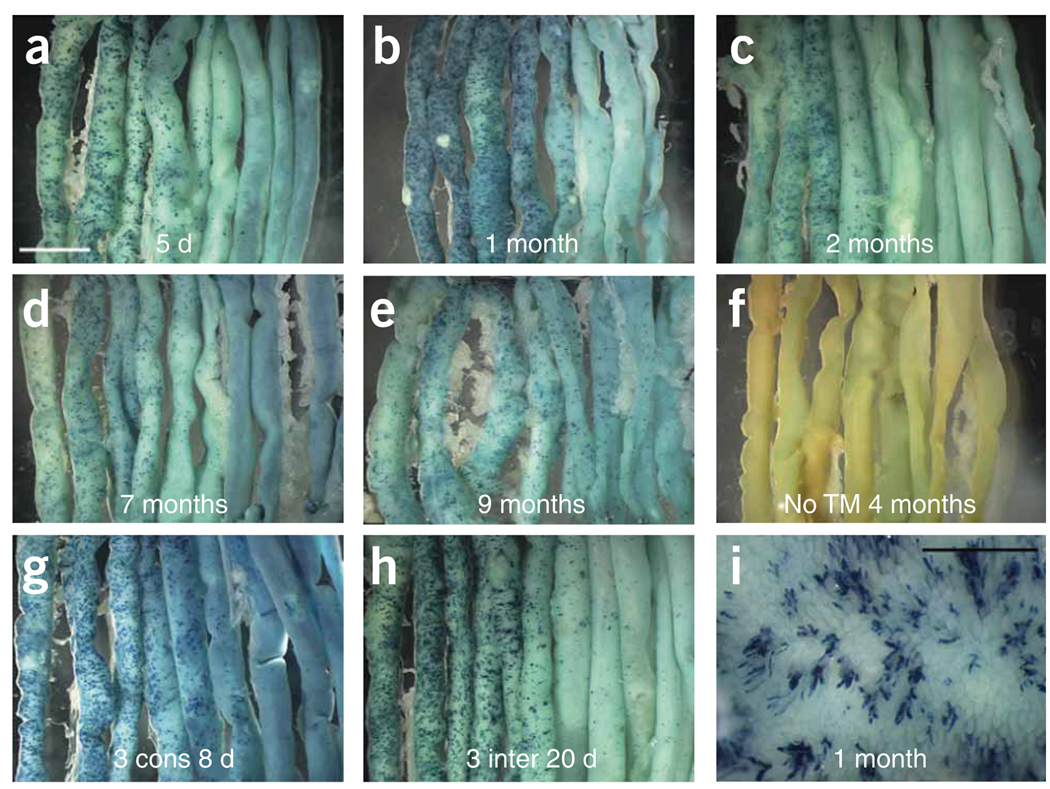
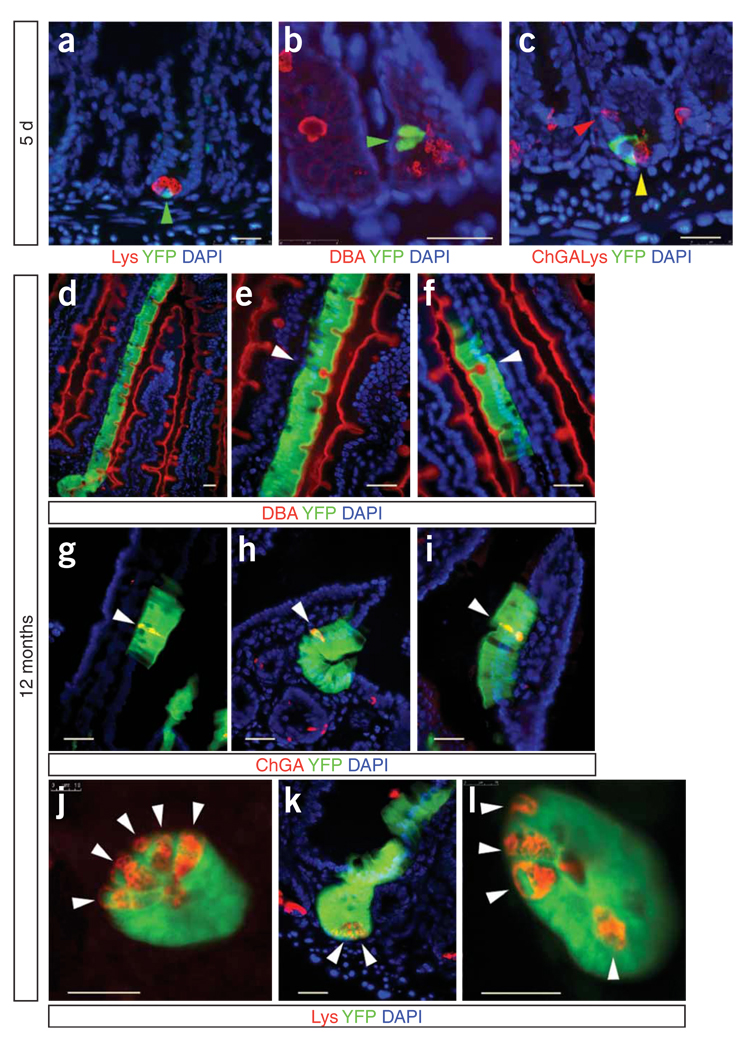
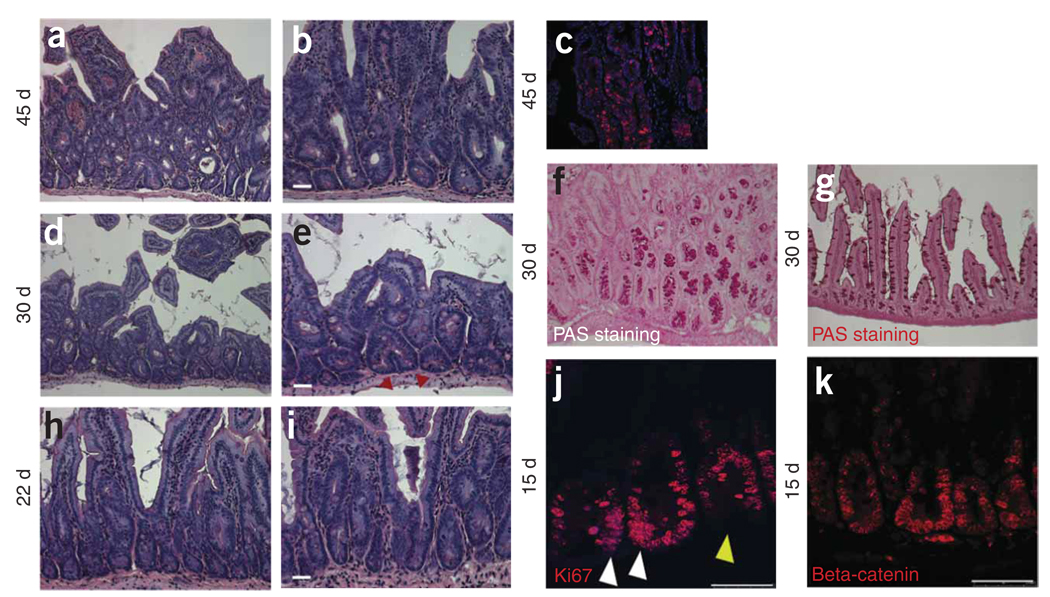
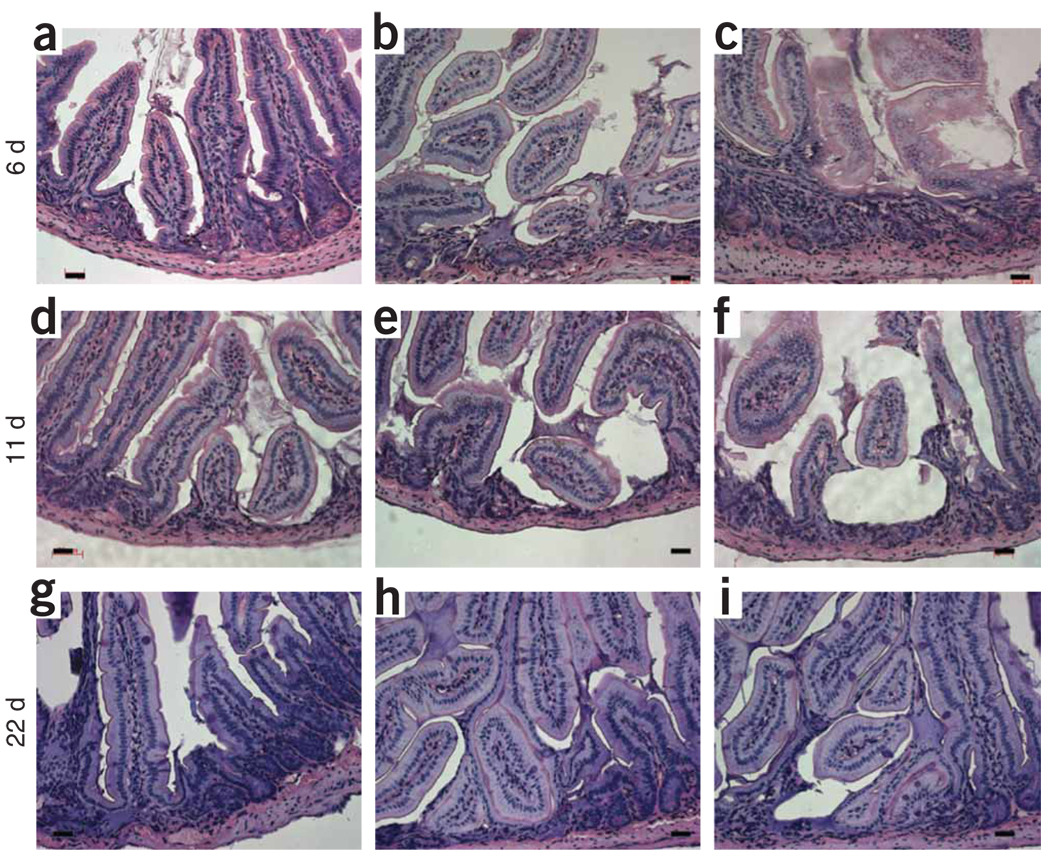
Bmi1 plays an essential part in the self-renewal of hematopoietic and neural stem cells. To investigate its role in other adult stem cell populations, we generated a mouse expressing a tamoxifen-inducible Cre from the Bmi1 locus. We found that Bmi1 is expressed in discrete cells located near the bottom of crypts in the small intestine, predominantly four cells above the base of the crypt (+4 position). Over time, these cells proliferate, expand, self-renew and give rise to all the differentiated cell lineages of the small intestine epithelium. The induction of a stable form of beta-catenin in these cells was sufficient to rapidly generate adenomas. Moreover, ablation of Bmi1(+) cells using a Rosa26 conditional allele, expressing diphtheria toxin, led to crypt loss. These experiments identify Bmi1 as an intestinal stem cell marker in vivo. Unexpectedly, the distribution of Bmi1-expressing stem cells along the length of the small intestine suggested that mammals use more than one molecularly distinguishable adult stem cell subpopulation to maintain organ homeostasis.


Figures

Figure 1
Figure 1
Early Bmi1+ lineage detection. (a–h) Bmi1CreER/+;Rosa26LacZ/+ mice were injected with tamoxifen, and after 20, 22, 24 or 30 h, the duodenum and the jejunum were stained in whole mount for LacZ and then longitudinally sectioned. Crypts cut along their major axis containing only single cell labeled were analyzed. a–c,e,g,h show representative pictures of crypts with a single LacZ+ cell present at position +4, +5 (yellow arrowheads). c,d,f show representative pictures of crypts in which more than one labeled cell is present. In c, the tip of the second cell is barely visible. Black arrowheads in d,f indicate cells that have already started migrating upward. (i–k) In situ hybridization of the small intestine with a control probe (i) labeling the Paneth cells and with a Bmi1 probe (j). Bmi1mRNA is present only at the bottom of the crypts in cells located above Paneth cells (red arrowhead). Digital magnification (2.5×) (k) of the crypt highlighted in j shows Bmi1 in a cell (black dashed line) located above a Paneth cell (red dashed line); next to the Paneth cell a crypt base columnar cell is visible (yellow dashed line). All photographs (except k) were captured at the same magnification. Scale bar, 50 µm.
Figure 2
Figure 2
Repopulation kinetics of the Bmi1+ lineage. (a–l) Small intestines were harvested from Bmi1CreER/+;Rosa26LacZ/+ mice at different time points from day 2 to day 30. We analyzed and followed crypts on serial adjacent sections and observed that, even after 19, 24 and 30 d, many crypts were half filled by the Bmi1+ lineage. (m) To evaluate the repopulation kinetics, fully labeled crypts were counted at different time points after tamoxifen injection. All the pictures were captured at the same magnification. Scale bar, 50 µm.
Figure 3
Figure 3
Bmi1+ lineage analysis in the small intestine. (a–e) After a single injection of tamoxifen, the Bmi1+ lineage is present from day 5 up to 9 months. The Bmi1+ lineage in the whole intestine is more abundant in the duodenum (top left corner) and in the first part of the jejunum, with almost no staining in the ileum (bottom right corner). After 1 month, there is an apparent modest progressive reduction in the number of labeled crypts. (f) The intestine of a 4-month-old Bmi1CreER/+;Rosa26LacZ/+ mouse does not show any LacZ staining without tamoxifen induction. (g,h) Two Bmi1CreER/+; Rosa26LacZ/+ mice received tamoxifen injection for 3 consecutive d (g), whereas two other mice with the same genotype were treated three times at 5-d intervals (h). Five days after the last injection, the intestines were harvested and stained for LacZ. (i) Intestinal mucosa of a Bmi1CreER/+; Rosa26LacZ/+ mouse 4 months after a single tamoxifen injection. The Bmi1+ lineage is visible on villi as a ‘line’ of cells coming from the crypt. White scale bar, 5 mm; black scale bar, 1 mm.
Figure 4
Figure 4
Assessment of Bmi1+ lineage after 5 d and after 12 months to evaluate the colocalization with differentiated-cell markers. (a–c) Five days after tamoxifen injection, the Bmi1+ lineage (YFP; green arrowheads) is present at the bottom of a crypt. The antibody to lysozyme (Lys) identifies Paneth cells (a). DBA stains Goblet cells (b). (c) Intestinal section showing staining with YFP, indicating the Bmi1+ lineage; chromogranin A (ChGA), labeling enteroendocrine cells (red arrowhead); and lysozyme antibody, indicating Paneth cells (yellow arrowhead). (d–l) After 12 months, the Bmi1+ lineage is present in all differentiated intestinal cell types. In d, the Bmi1 lineage is expanding from a crypt all the way to the top of an adjacent villus; several goblet cells (DBA+) are present in the Bmi1 lineage. e is a 2×magnification of d. The white arrowhead indicates a goblet cell. Another Bmi1+ goblet cell is shown in f (white arrowhead). g–i show three examples of enteroendocrine cells (ChGA+; white arrowheads) within the Bmi1 lineage. Two transverse (j,l) and one longitudinal (k) section of Bmi1+ crypts, showing that Paneth cells (Lys+; white arrowheads) are present in the Bmi1 lineage. Scale bars, 25 µm.
Figure 5
Figure 5
Bmi1CreER/+;Ctnnb1Ex3LoxP/+ cross. Forty-five days after tamoxifen injection, the duodenum and the jejunum contain multiple adenomas. (a,b) Low (a) and high (b) magnifications. (c) The adenomas were BrdU positive. (d,e) Low (d) and (e) high magnifications. At day 30, only a few adenomas are visible. In many areas with or without adenomas, many crypts were in fission (red arrowheads). (f,g) Many crypts showed numerous periodic acid–Schiff (PAS)-positive cells (Paneth and goblet cells) present (f), indicating an expansion of the secretory compartment compared to the wild-type intestine (g). (h,i) Low (h) and (i) high magnification. At day 22 only rare adenomas were visible. (j) After staining with Ki67, many crypts showed increased number of proliferating cells crowded at the position where ISCs are located (white arrowheads). The yellow arrowhead indicates an adjacent crypt showing the normal Ki67 staining. (k) β-catenin staining, showing ubiquitous expression. Scale bars: 25 µm (b,e,i); 50 µm (j,k).
Figure 6
Figure 6
Intestinal stem cell ablation. After one injection of tamoxifen, Bmi1CreER/+;Rosa26DTA/+ mice were killed at different time points and their small intestine analyzed. (a–i) Representative pictures at 6, 11 and 22 d showing patches of intestinal mucosa disorganized and in disarray, without crypts. The ablation of the Bmi1+ ISC lineage is responsible for the crypt loss. Scale bar, 50 µm.

Comment in

References

    1. Wagers AJ, Weissman IL. Plasticity of adult stem cells. Cell. 2004;116:639–648. - PubMed
    1. Seaberg RM, van der Kooy D. Stem and progenitor cells: the premature desertion of rigorous definitions. Trends Neurosci. 2003;26:125–131. - PubMed
    1. Shackleton M, et al. Generation of a functional mammary gland from a single stem cell. Nature. 2006;439:84–88. - PubMed
    1. Ahn S, Joyner AL. In vivo analysis of quiescent adult neural stem cells responding to Sonic hedgehog. Nature. 2005;437:894–897. - PubMed
    1. Lessard J, Sauvageau G. Bmi-1 determines the proliferative capacity of normal and leukaemic stem cells. Nature. 2003;423:255–260. - PubMed

Publication types