

Multivariate Granger causality analysis of fMRI data
- PMID: 18537116
- PMCID: PMC6870657
- DOI: 10.1002/hbm.20606
Multivariate Granger causality analysis of fMRI data
Abstract
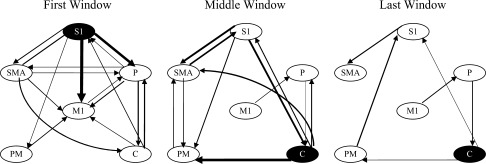
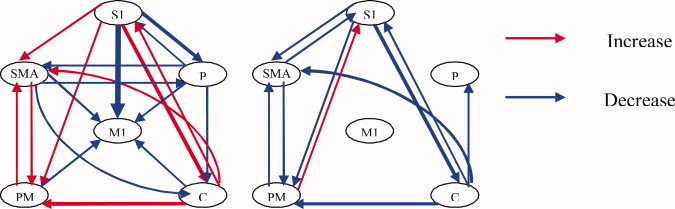
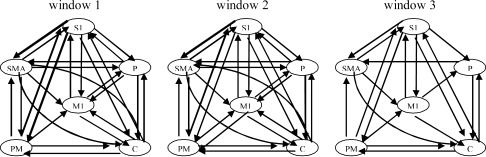
This article describes the combination of multivariate Granger causality analysis, temporal down-sampling of fMRI time series, and graph theoretic concepts for investigating causal brain networks and their dynamics. As a demonstration, this approach was applied to analyze epoch-to-epoch changes in a hand-gripping, muscle fatigue experiment. Causal influences between the activated regions were analyzed by applying the directed transfer function (DTF) analysis of multivariate Granger causality with the integrated epoch response as the input, allowing us to account for the effects of several relevant regions simultaneously. Integrated responses were used in lieu of originally sampled time points to remove the effect of the spatially varying hemodynamic response as a confounding factor; using integrated responses did not affect our ability to capture its slowly varying affects of fatigue. We separately modeled the early, middle, and late periods in the fatigue. We adopted graph theoretic concepts of clustering and eccentricity to facilitate the interpretation of the resultant complex networks. Our results reveal the temporal evolution of the network and demonstrate that motor fatigue leads to a disconnection in the related neural network.
2008 Wiley-Liss, Inc.
Figures
References
-
- Abler B,Roebroeck A,Goebel R,Hose A,Schfnfeldt‐Lecuona C,Hole G,Walter H ( 2006): Investigating directed influences between activated brain areas in a motor‐response task using fMRI. Magn Reson Imaging 24: 181–185. - PubMed
-
- Aguirre GK,Zarahn E,D'Esposito M ( 1998): The variability of human, BOLD hemodynamic responses. Neuroimage 8: 360–369. - PubMed
-
- Akaike H ( 1974): A new look at the statistical model identification. IEEE Trans Automat Contr 19: 716–723.
-
- Blinowska KJ,Kus R,Kaminski M ( 2004): Granger causality and information flow in multivariate processes. Phys Rev E 70: 50902–50906. - PubMed
Publication types
MeSH terms
Substances
Grants and funding
LinkOut - more resources
Full Text Sources
Other Literature Sources
Medical
Research Materials
