Comparative Study
. 2008 Aug 10;509(5):493-513.
doi: 10.1002/cne.21757.

Synaptic circuits of the Drosophila optic lobe: the input terminals to the medulla

Affiliations
Comparative Study

Synaptic circuits of the Drosophila optic lobe: the input terminals to the medulla

Shin-Ya Takemura et al. J Comp Neurol. .

Abstract

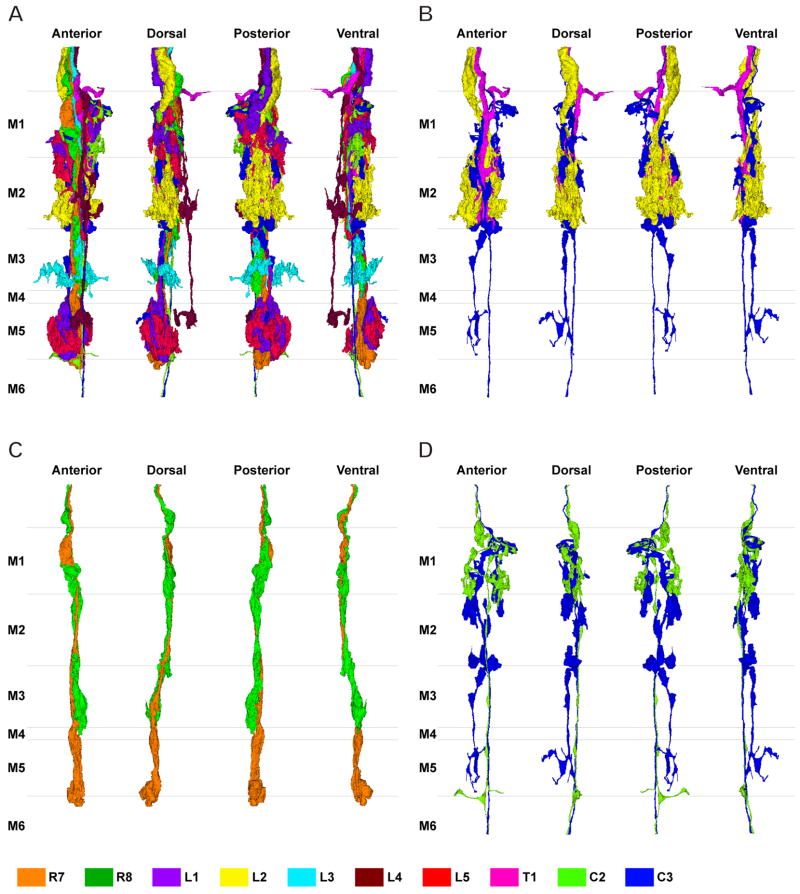
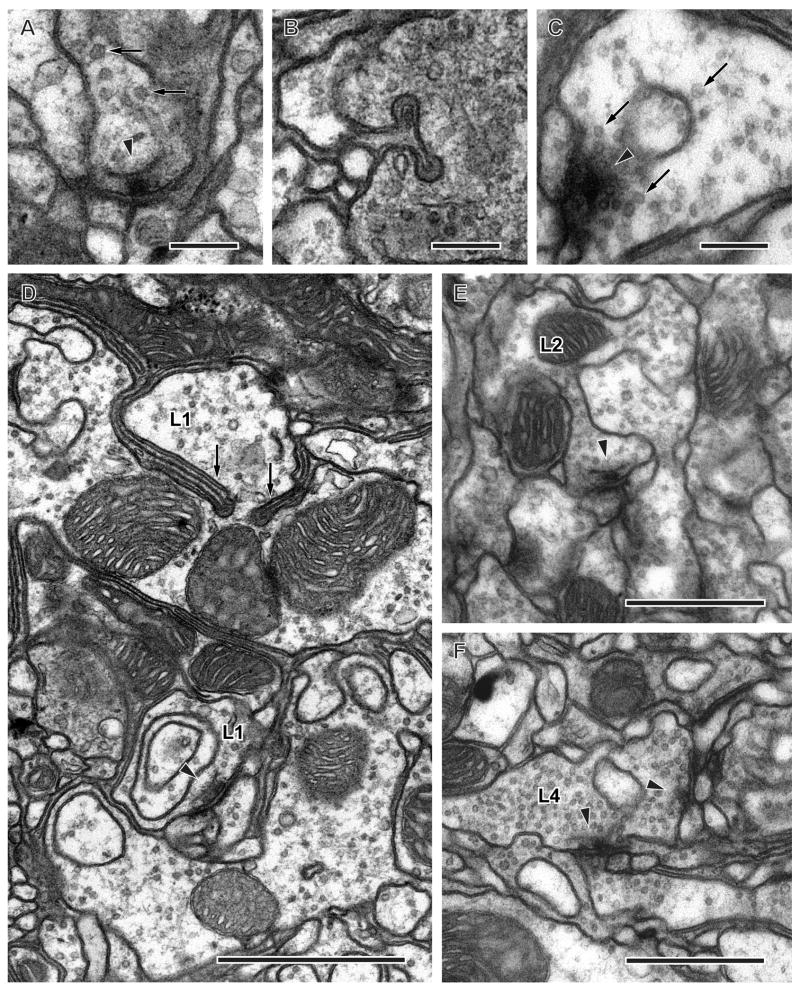
Understanding the visual pathways of the fly's compound eye has been blocked for decades at the second optic neuropil, the medulla, a two-part relay comprising 10 strata (M1-M10), and the largest neuropil in the fly's brain. Based on the modularity of its composition, and two previous reports, on Golgi-impregnated cell types (Fischbach and Dittrich, Cell Tissue Res.,1989; 258:441-475) and their synaptic circuits in the first neuropil, the lamina, we used serial-section electron microscopy to examine inputs to the distal strata M1-M6. We report the morphology of the reconstructed medulla terminals of five lamina cells, L1-L5, two photoreceptors, R7 and R8, and three neurons, medulla cell T1 and centrifugal cells C2 and C3. The morphology of these conforms closely to previous reports from Golgi impregnation. This fidelity provides assurance that our reconstructions are complete and accurate. Synapses of these terminals broadly localize to the terminal and provide contacts to unidentified targets, mostly medulla cells, as well as sites of connection between the terminals themselves. These reveal that R8 forms contacts upon R7 and thus between these two spectral inputs; that L3 provides input upon both pathways, adding an achromatic input; that the terminal of L5 reciprocally connects to that of L1, thus being synaptic in the medulla despite lacking synapses in the lamina; that the motion-sensing input cells L1 and L2 lack direct interconnection but both receive input from C2 and C3, resembling lamina connections of these cells; and that, as in the lamina, T1 provides no output chemical synapses.


Figures

Fig. 1
Fig. 1
Horizontal section of a Drosophila visual system from a preparation stained by the Bodian method. Up: direction of the animal’s anterior. Horizontal rows of cartridges parallel to the equator in the lamina neuropile (L) connect to horizontal rows of columns in the medulla (M) by means of sheets of fibres that traverse the external chiasma (EC). The medulla is subdivided into two parts, outer (distal, strata M1–M6) and inner (proximal, strata M7–M10), by its middle stratum, which connects to Cuccatti’s bundle and contains laterally-orientated axons of many medulla tangential neurons. Each input terminal from the lamina terminates in a specific stratum of the outer (distal) medulla. R, retina; IC, internal chiasma; Lo, lobula; Lp, lobula plate. Scale bar: 50 μm.
Fig. 2
Fig. 2
Low power montage of a tangential section at a distal level in the medulla neuropile, revealing the three columns (boxes, 1–3) traced through the series from which this image is one section. Sheets of chiasmal fibres (arrowheads) innervate the columns of medulla neuropile. Inset: Column 2 at higher magnification and from a slightly deeper section, illustrating the position of R7 and R8 in this column from the dorsal eye field. Column 2 is separated by 5 dorsoventral column rows from column 1. Dorsal (D) and anterior (A) directions indicate the orientation of the head. Scale bar: 20 μm (inset 2 μm).
Fig. 3
Fig. 3
Profiles of the 10 cells reconstructed in three dimensions from column 2 in Fig. 2: R7 and R8, L1–L5, C2 and C3, and T1. Because the column is oval in cross section, each cell is shown from four views: from anterior looking posterior (A), in the plane of the chiasma, from dorsal looking ventral (C), and oblique views rotated 45° from the dorsal towards anterior (B) or towards the posterior (D). Borders are indicated between strata M1–M6. Estimated scale of the distance from the distal edge of stratum M1 is shown in the left side. The levels of panels in Figs. 6 and 7 are shown by arrowheads (right side). Enlarged images of terminal arbors of L1–L5 in a posterior view looking anterior (E–L): L1’s bi-lobed arbor in stratum M1 (E) and clubbed terminal in stratum M5 (F); L2’s terminal arbor in stratum M2 (G); L3’s terminal arbor in stratum M3 (H); L4’s spreading arbor in stratum M2 (I) and small terminal in stratum M5 (J); L5’s branched arborization in strata M1/M2 (K) and compact clump in stratum M5 (L). Scale bar: 5 μm (in G, same magnification for E–L)
Fig. 4
Fig. 4
Reconstruction of multiple terminals in a single column shown together from four different views at successive 90° rotations in a anticlockwise direction, from the distal surface looking in (far left: view from anterior looking posterior). A: 10 cells reconstructed together. B: C3 (blue) makes contact with L2 (yellow) and T1 (pink) in strata M1 and M2. C: R8 (green) travels with R7 (orange), and is presynaptic to R7. D: The main axon of C2 (yellow-green) and C3 (blue) travel side by side through the medulla within the column.
Fig. 5
Fig. 5
A: Reconstruction of the terminals of R8 (green), L1 (purple) and L5 (red). The terminals of L1 and L5 overlap each other closely and have reciprocal synaptic connections in strata M1 and M5. R8 is presynaptic to both L1 and L5 in stratum M1. The axon of L5 has a characteristic inflection around the depth between strata M2 and M3 (arrow). B: Reconstruction of L1 (purple), L2 (yellow), C2 (green), and C3 (blue). C3’s short collateral arising from its main axon at the border between strata M2 and M3 travels along the axon of L1 and has synaptic contacts in stratum M5 (arrow). C2 and C3 have numerous synaptic contacts with L1 and L2 (see text for details).
Fig. 6
Fig. 6
Four sections of column 2 from a series of 530 aligned images reveal profiles of all input terminals in the two outermost strata. Profiles of each cell are colour-coded as in Fig. 3, as follows: orange (R7), green (R8), purple (L1), yellow (L2), sky-blue (L3), dark-red (L4), pale-red (L5), yellow-green (C2), blue (C3), and pink (T1). A: Distal region of stratum M1 (M1-d) showing the axon bundle at the chiasma/neuropile border (section no. 73). B: Proximal region of stratum M1 (M1-p) at the level of the expanded terminals of L1 (section no. 123). C: Distal region of stratum M2 (M2-d) at the level of the expanded terminal of L2 (section no. 191). D: Proximal region of stratum M2 (M2-p) containing profiles of the L2 terminal and the divided profiles of the L4 arborization (section no. 240). Dorsal (D) and anterior (A) directions indicate the orientation of the head (in B, for all images). Scale bar: 2 μm (in D, for all images). Micrographs without colour overlays can be found as supplemental figures.
Fig. 7
Fig. 7
Four sections of column 2 in strata M3–M6, continuing those of Fig. 6. A: Stratum M3 containing the spreading terminals of L3 (section no. 347). Note that the dorso-ventrally directed processes of the L3 terminal extend slightly beyond the border of the panel. B: Stratum M4 (section no. 364). C: Stratum M5 at the level of the terminal of L5 and the proximal terminal of L1 showing the three terminals of L4 (section no. 416). D: Stratum M6 at the level of the profiles of the surviving R7 terminal (section no. 479). Dorsal (D) and anterior (A) directions indicate the orientation of the head (in B, for all images). Scale bar: 2 μm (in D, for all images). Micrographs without colour overlays can be found as supplemental figures.
Fig. 8
Fig. 8
Distribution of presynaptic sites along the depths of the terminals of R7 and R8 and L1–L5 in the three reconstructed columns. The profiles of each cell are plotted as a function of section number in the series, from distal (#001) to proximal (#530), and each presynaptic site is indicated by a dot. For each cell (L1–L5), the saturated colour indicates the depth of its expanded terminal. R7 and R8 lack a clear boundary between axon and terminal. The total number of presynaptic sites is shown for each terminal, at the bottom of the bar and, for L1, L4 and L5, above the distal and below the proximal terminal.
Fig. 9
Fig. 9
Synaptic organelles of photoreceptor and lamina cell terminals in the medulla. A: Presynaptic T-bar ribbon (arrowhead) and synaptic vesicles (arrows) in the photoreceptor terminal R8. B: Invaginating organelle, resembling a capitate projection, in the photoreceptor terminal, arising from an unidentified glial cell. C: Cruciform presynaptic density (arrowhead), the en face view of the pedestal of a T-bar ribbon, and surrounding synaptic vesicles (arrows) in L1 terminal. D: Terminals of L1 have thin invaginating partitions in stratum M5 (arrows). Arrowhead indicates cross-sectioned presynaptic T-bar ribbon in L1 profile. E: L2 is presynaptic to unknown profiles which are probably medulla cells (arrowhead). F: L4 is presynaptic to unidentified profiles which are probably medulla cells in stratum M5 (arrowheads). Scale bars: 0.2 μm (AC); 1 μm (D); 0.5 μm (E, F)
Fig. 10
Fig. 10
Synaptic contacts between input terminals in the medulla column. Arrowheads: T-bar ribbon in presynaptic elements. A: R8 provides input upon L1 and L5. B: C3 provides input upon L2 and T1. C: R8 provides input upon R7 at a dyad. D: L1 provides input upon L5, which is reciprocated at a second site (E). All synapses are of the multiple-contact type and additional postsynaptic elements are not identified. Scale bar: 0.5 μm (in B, for all images).
Fig. 11
Fig. 11
Summary diagram of synaptic connections between input terminals to the medulla. The terminals are also presynaptic to many unknown profiles, mostly medulla neurons, that are not yet identified. The numbers of synapses we found in column 2 are indicated by each arrow. The possible neurotransmitter of C2 and C3 (Kolodziejczyk et al., 2008) is GABA (asterisk). Grey shaded panels (p1, p2, p3a,b) represent the previously proposed visual relay pathways (pathway 1, 2, 3a and 3b) of Bausenwein et al. (1992), see text for details). R8 differs from R7 in providing input to L1 and L5, which are themselves reciprocally connected. L1 and L2 have different medulla targets, one of L2’s targets also receiving input from L4. L2 receives input from C2 and C3, as it also does in the lamina while, unlike its connections in the lamina, L1 provides input to C2 and C3 that is reciprocal for C2.

References

    1. Abercrombie M. Estimation of nuclear population from microtome sections. Anat Rec. 1946;94:239–247. - PubMed
    1. Bausenwein B, Fischbach K-F. Activity labeling patterns in the medulla of Drosophila melanogaster caused by motion stimuli. Cell Tiss Res. 1992;270:25–35. - PubMed
    1. Bausenwein B, Dittrich APM, Fischbach K-F. The optic lobe of Drosophila melanogaster II. Sorting of retinotopic pathways in the medulla. Cell Tissue Res. 1992;267:17–28. - PubMed
    1. Bodian D. The generalized vertebrate neuron. Science. 1962;137:323–326. - PubMed
    1. Borst A. Models of motion detection. Nat Neurosci. 2000;3(Suppl):1168. - PubMed

Publication types

MeSH terms

LinkOut - more resources