Comparative Study
. 2008 Aug 10;509(5):474-92.
doi: 10.1002/cne.21770.

Bone morphogenetic protein regulation of enteric neuronal phenotypic diversity: relationship to timing of cell cycle exit

Affiliations
Comparative Study

Bone morphogenetic protein regulation of enteric neuronal phenotypic diversity: relationship to timing of cell cycle exit

Alcmène Chalazonitis et al. J Comp Neurol. .

Abstract

The effects of bone morphogenetic protein (BMP) signaling on enteric neuron development were examined in transgenic mice overexpressing either the BMP inhibitor, noggin, or BMP4 under control of the neuron specific enolase (NSE) promoter. Noggin antagonism of BMP signaling increased total numbers of enteric neurons and those of subpopulations derived from precursors that exit the cell cycle early in neurogenesis (serotonin, calretinin, calbindin). In contrast, noggin overexpression decreased numbers of neurons derived from precursors that exit the cell cycle late (gamma-aminobutyric acid, tyrosine hydroxylase [TH], dopamine transporter, calcitonin gene-related peptide, TrkC). The numbers of TH- and TrkC-expressing neurons were increased by overexpression of BMP4. These observations are consistent with the idea that phenotypic expression in the enteric nervous system (ENS) is determined, in part, by the number of proliferative divisions neuronal precursors undergo before their terminal mitosis. BMP signaling may thus regulate enteric neuronal phenotypic diversity by promoting the exit of precursors from the cell cycle. BMP2 increased the numbers of TH- and TrkC-expressing neurons developing in vitro from immunoselected enteric crest-derived precursors; BMP signaling may thus also specify or promote the development of dopaminergic TrkC/NT-3-dependent neurons. The developmental defects in the ENS of noggin-overexpressing mice caused a relatively mild disturbance of motility (irregular rapid transit and increased stool frequency, weight, and water content). Although the function of the gut thus displays a remarkable tolerance for ENS defects, subtle functional abnormalities in motility or secretion may arise when ENS defects short of aganglionosis occur during development.


Figures

Figure 1
Figure 1
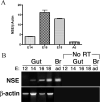
Transcription of NSE is developmentally regulated in developing mouse gut. A. Real-time PCR was used to quantify NSE transcripts in fetal mouse gut. NSE transcripts were detectable at E14 and increased significantly at E16−18 (p < 0.001). The relative abundance of NSE transcripts was lower in adult than fetal gut (p < 0.001). B. Semiquantitative RT-PCR. Transcripts encoding NSE were not detected at E12, but were present in the fetal bowel at E14, 16, and 18. The brain (Br) was investigated as a positive control. DNA contamination was minimal because no PCR product was obtained in the absence of RT.
Figure 2
Figure 2
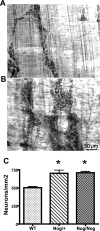
The total number of neurons is increased in the myenteric plexus of the colons of transgenic mice that overexpress noggin. Cuprolinic blue was used to visualize neurons. A. Wild-type. B. Nog/Nog. Bar = 50μm. C. The density of neurons is significantly increased in both Nog/+ and Nog/Nog mice (p < 0.001; n = 20 × 10 contiguous non-overlapping rectangular fields).
Figure 3
Figure 3
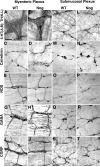
Immunoreactivities identifying neuronal subsets in enteric plexuses that are found to be increased or decreased in noggin-over expressing mice compared to WT. Neurons marked by the immunoreactivities of 5-HT (A, B), calretinin (C, D; M, N), NOS (E, F; O, P), GABA (G, H; Q, R), CGRP (I, J; S, T), and TH (K, L) were visualized and counted in myenteric (A-J) and submucosal plexuses (K-T) of WT and noggin-overexpressing mice. 5-HT-immunoreactive neurons were found only in the myenteric plexus and TH-immunoreactive neurons were sufficiently abundant to count only in the submucosal plexus. The bars = 50 μm.
Figure 4
Figure 4
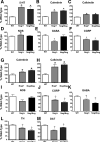
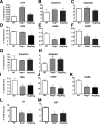
Transgenic overexpression of noggin alters the relative densities of different phenotypes of enteric neuron. The density of each type of neuron, as a % of the density of the same type of neuron in WT mice, was determined in Nog/+ and Nog/Nog mice (see Tables 3 and 4). Densities of myenteric neurons identified by the immunoreactivities of 5-HT (A), calretinin (B), and calbindin (C) and NOS (D) neurons increased significantly (*), while GABA (E) [in Nog/+] and CGRP (F) neurons decreased significantly (†) in transgenic animals. Densities of submucosal neurons identified by the immunoreactivities of calretinin (G) and calbindin (H) increased significantly (*; p < 0.05), NOS (I) did not change significantly, while CGRP (J), GABA (K), TH (L), and DAT (M) neurons all decreased significantly (†; p < 0.05) in transgenic animals.
Figure 5
Figure 5
Transgenic overexpression of noggin alters the relative proportions of different phenotypes of enteric neuron. The proportions, as a % of total neurons of different types of enteric neuron were compared, in each region of the bowel, in WT and noggin-overexpressing mice (Nog/+ and Nog/Nog); effects of the transgene were again phenotype-dependent. The proportion of myenteric neurons identified by the immunoreactivities of 5-HT (A) increased significantly (*; p < 0.05 Nog/+ only), calretinin (B), and calbindin (C) were now unchanged, while NOS (D) neurons (Nog/Nog only), GABA (E) and CGRP (F) neurons decreased significantly (†; p < 0.05) in transgenic animals. The proportion of submucosal neurons identified by the immunoreactivities of calretinin (G) did not change, calbindin (H) increased significantly (*; p < 0.05), while NOS (I), CGRP (J), GABA (K), TH (L), and DAT (M) neurons all decreased significantly (†; p < 0.05) in transgenic animals.
Figure 6
Figure 6
Timing of the exit from the cell cycle of precursors that give rise to neurons identified by the immunoreactivities of calbindin, NOS, GABA, and TrkC as determined by injecting BrdU into dated-pregnant mice. Neurons labeled by BrdU during the final mitosis of their precursors were identified by simultaneously demonstrating BrdU immunoreactivity with that of the neuronal markers. One measurement of the proportion of BrdU-labeled neurons was determined as the sum of BrdU-labeled neurons divided by the total number of neurons of a specific phenotype found in 10 scanned fields. Each measurement was then repeated 5−24 times. The numbers found in each measurement were then totaled and divided by the number of measurements to calculate the mean. Cell cycle exit dates are shown at the left and for each age a histogram is plotted showing the % of each type of neuron labeled with BrdU. A. E12.5 Myenteric plexus. B. E12.5 Submucosal plexus. C. E14.5 Myenteric plexus. D. E14.5 Submucosal plexus. E. E17.5 Myenteric plexus. F. E17.5 Submucosal plexus. G. P1 Myenteric plexus. H. P1 Submucosal plexus. I-L. BrdU labeling (magenta) of GABA-immunoreactive neurons (green) in the myenteric (MyP) and submucosal (SmP) plexuses: I. E17.5, myenteric plexus; J. E17.5, submucosal plexus; K. P1, myenteric plexus; L. P1, submucosal plexus . Arrows indicate doubly labeled cells. The bar = 50 μm.
Figure 7
Figure 7
Overexpression of BMP4 under the control of the NSE promoter increases the proportion of enteric neurons that express TH and TrkC. A. The overall density of neurons in the submucosal plexus in WT and BMP4-overexpressing mice is not significantly different. B. The overall density of neurons in the myenteric plexus in WT and BMP4-overexpressing mice is not significantly different. C. The proportion of submucosal neurons that expresses TH is significantly (* p < 0.03) greater in BMP4-overexpressing (n = 36) than WT mice (n = 32). D. TH immunoreactivity in the submucosal plexus of a WT mouse. E. TH immunoreactivity in the submucosal plexus of a BMP4-overexpressing mouse. F. TrkC immunoreactivity in the submucosal plexus of a WT mouse. G. TrkC immunoreactivity in the submucosal plexus of a BMP4-overexpressing mouse. H. The proportion of submucosal neurons that expresses TrkC is significantly (* p < 0.05) greater in BMP4-overexpressing than in WT mice. I. TrkC immunoreactivity in the myenteric plexus of a WT mouse. J. TrkC immunoreactivity in the myenteric plexus of a BMP4-overexpressing mouse. K. The proportion of myenteric neurons that expresses TrkC is significantly (** p < 0.01) greater in BMP4-overexpressing than in WT mice. The bars = 60 μm.
Figure 8
Figure 8
BMP2 and NT-3 promote the in vitro development of TH-expressing (dopaminergic) enteric neurons. Crest-derived precursors were immunoselected from the fetal rat gut at E14 and cultured for 4 days. TH was immunostained simultaneously with MAP1b, which was employed as a neuronal marker. A-E. TH-immunoreactive neurons developing in cultures exposed only to vehicle; A. TH (magenta); B. MAP1b (green); C. Merge (coincident expression is white). B-F. TH-immunoreactive neurons developing in cultures exposed to BMP2 (20 ng/ml) + NT-3 (40 ng/ml). B. TH (magenta); D. MAP1b (green); F. Merge. G. BMP2 increases in a concentration-dependent manner the number of developing enteric neurons that express TH (* p < 0.05). NT-3 increases the number of developing enteric neurons that express TH (* p < 0.05); however, the combination of BMP2 + NT-3 does not promote more TH-immunoreactive neurons than that induced by BMP2 (20 ng/ml) alone. There were 4−7 cultures in each group.
Figure 9
Figure 9
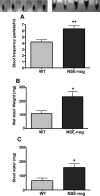
The stool frequency, weight, and water content are all increased in mice that overexpress noggin under control of the NSE promoter. A. Stool frequency was determined by counting the number of fecal pellets passed during a 1-hr period of observation. Pellets collected from individual animals are illustrated above the bar graph in which the results are quantified (WT at the left; NSE-noggin mice at the right). B. Stool weight (obtained wet) for the pooled fecal pellets illustrated above. C. The stool water content was estimated from the difference between the wet and dry weights of stool. (** p < 0.01; * p < 0.05; WT n = 5; NSE-Nog n = 6).

Similar articles

Cited by

References

    1. Allain AE, Meyrand P, Branchereau P. Ontogenic changes of the spinal GABAergic cell population are controlled by the serotonin (5-HT) system: implication of 5-HT1 receptor family. J Neurosci. 2005;25(38):8714–8724. - PMC - PubMed
    1. Anderson RB, Stewart AL, Young HM. Phenotypes of neural-crest-derived cells in vagal and sacral pathways. Cell Tissue Res. 2006;323(1):11–25. - PubMed
    1. Azmitia EC. Modern views on an ancient chemical: serotonin effects on cell proliferation, maturation, and apoptosis. Brain Res Bull. 2001a;56(5):413–424. - PubMed
    1. Azmitia EC. Neuronal instability: implications for Rett's syndrome. Brain Dev. 2001b;23(Suppl 1):S1–S10. - PubMed
    1. Bellier S, Da Silva NR, Aubin-Houzelstein G, Elbaz C, Vanderwinden JM, Panthier JJ. Accelerated intestinal transit in inbred mice with an increased number of interstitial cells of Cajal. Am J Physiol Gastrointest Liver Physiol. 2005;288(1):G151–158. - PubMed

Publication types

MeSH terms