. 2008 Jul 1;47(26):6859-69.
doi: 10.1021/bi800204k. Epub 2008 Jun 7.

Structure of yeast poly(A) polymerase in complex with a peptide from Fip1, an intrinsically disordered protein

Affiliations

Structure of yeast poly(A) polymerase in complex with a peptide from Fip1, an intrinsically disordered protein

Gretchen Meinke et al. Biochemistry. .

Abstract

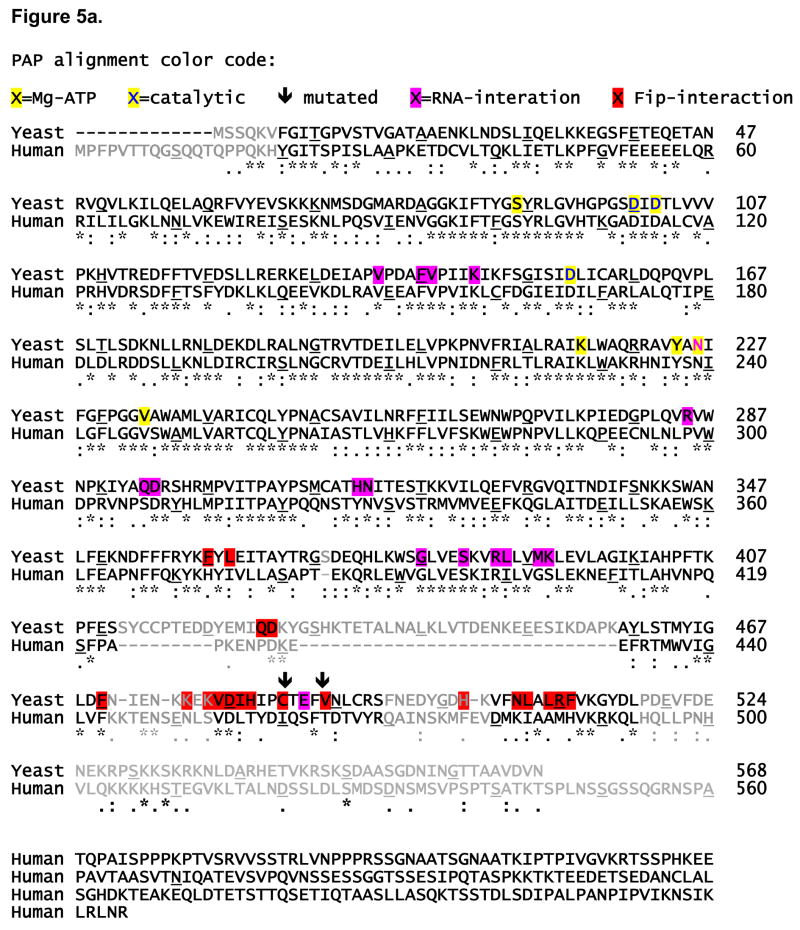
In yeast, the mRNA processing enzyme poly(A) polymerase is tethered to the much larger 3'-end processing complex via Fip1, a 36 kDa protein of unknown structure. We report the 2.6 A crystal structure of yeast poly(A) polymerase in complex with a peptide containing residues 80-105 of Fip1. The Fip1 peptide binds to the outside surface of the C-terminal domain of the polymerase. On the basis of this structure, we designed a mutant of the polymerase (V498Y, C485R) that is lethal to yeast. The mutant is unable to bind Fip1 but retains full polymerase activity. Fip1 is found in all eukaryotes and serves to connect poly(A) polymerase to pre-mRNA processing complexes in yeast, plants, and mammals. However, the Fip1 sequence is highly divergent, and residues on both Pap1 and Fip1 at the observed interaction surface are poorly conserved. Herein we demonstrate using analytical ultracentrifugation, circular dichroism, proteolytic studies, and other techniques that, in the absence of Pap1, Fip1 is largely, if not completely, unfolded. We speculate that flexibility may be important for Fip1's function as a molecular scaffold.


Figures

Figure 1
Figure 1. Structure of the Pap1-Fippbd complex
A) The simulated annealing omit map of Fippbd calculated in CNS (43) and contoured at 3 sigma. Electron density for residues at both termini was weak, and sidechain atoms beyone the alpha carbon were not built into the model for these residues. The central portion of the peptide exhibited unambiguous density. B) Structure of the Pap1/Fip1 complex with Fippbd shown in purple. In this view, the central, substrate-binding cleft of Pap1 is clearly visible. Arrows denote the location of the active site and the approximate locations of the two hinge regions. In the closed, RNA-bound complex, the three domains move with respect to one another via these hinges and the upper parts of the Palm and C-terminal domains contact one another, encircling the single-stranded RNA. There is no overlap between the substrate-binding site and that of Fippbd. C) Schematic diagram showing hydrogen bonding interactions within Fip1 and between Fip1 and Pap1. The hydrophobic residues that interact with Pap1 are marked with yellow circles. D) Surface representation of the Pap1 C-terminal domain (left) and Fip1pbd (right). The view of Pap1 is rotated approximately 90 degrees about the vertical axis relative to Figure 1A, such that the view is of the face of Pap1 to which Fip1 is bound. Fip1 has been removed and rotated such that the right part of the figure shows the face of Fip1 which Pap1 is bound. The surface has been colored according to atom type (green = carbon, red = oxygen, blue = nitrogen, and yellow = sulphur) so as to highlight the hydrophobicity of both halves of the interface. E) Stereo view of the complex. Pap1 is shown in green with labels in blue. The Fippbd peptide is shown in blue, with black labels. The Pap1 residues mutated to disrupt the interface are mostly hidden behind Fippbd in this view. V489 lies directly beneath the sidechain hydroxyl of Y102. C485 is behind the mainchain segment from I85–S86.
Figure 2
Figure 2. Characterization of the C485R/V489Y mutation in the Fip1 interaction domain of Pap1
A) Lanes with the wild type Pap1 enzyme are labeled P. Those with the double mutant are labeled Pm. F is used to denote Fip1. To form the complexes, 2.5 μg of bacterially-expressed, purified Fip192 was combined with wild type and mutant Pap1 at the stiochiometries indicated. Samples were run on a 10% polyacrylimide gel made at pH 8.8 using a tris-borate buffer system. B) Yeast containing a PAP1 chromosomal deletion and the PAP1 gene on a URA3 plasmid were transformed with a LEU2+ plasmid containing the PAP1-Δ10 or pap1-Δ10,C485R/V489Y allele. Transformants were grown on Complete Media minus Leucine and Uracil (CM –Leu, Ura) or on media containing 5-Fluoroorotic Acid (5FOA), which forces loss of the URA3 plasmid. Growth on 5FOA is observed only with cells containing PAP1-Δ10.C) The pap1-Δ10,C485R/V489Y mutant protein is expressed in yeast at the same level as wild-type Pap1. Western Blot was performed on extracts from cells expressing only a TAP-tagged Pap1 or the TAP-tagged Pap1 and either pap1-Δ10,C485R/V489Y or Pap1-Δ10 using a Pap1-specific antibody. The upper bands are the TAP-tagged Pap1. The lower ones are the native and mutant proteins without the TAP tag.
Figure 3
Figure 3. Biochemical and biophysical studies of Fip1 and the Fip1-Pap1 complex
A) Dynamic light scattering results from Pap1 alone, Fip192 alone, and a 1:1 complex of the proteins demonstrates that Fip1 has larger radius than would be expected of a protein of this size and that neither the protein alone nor the Pap1-Fip1 complex forms aggregates. B) Analytical ultracentrifugation of Fip220. Data from four solutions of Fip1 (at 1.15 mg/ml, 0.38 mg/ml, 0.138 mg/ml, and 0.044 mg/ml) are shown. C) Proteolysis of Fip1, the Pap1-Fip1 complex, and Pap1 alone with Endoproteinase Glu C, Trypsin and Chymotrypsin. For each protein or complex the undigested sample is followed by five time points during the course of the digestion. Samples were taken after 8 min, 20 min, 80 min, 5 hours, and 22 hours. D) Circular dichoism spectrum of Fip192. Theoretical spectra of pure a-helix, b-sheet, and random coil are shown for comparison. E) Circular dicroism melting curve of Fip192 taken at 208 nm.
Figure 4
Figure 4. Determination of PAP-Fip binding constant by inhibition kinetics
The initial velocity was plotted as a function of Fip220 concentration, and the data analyzed according to a model describing partial, tight-binding inhibition. The experiment included 36 pM of PAP, 120 μM MgATP, 53 μM A18, and 10 mM MgCl2. Fip220 was added up to a 10-fold molar excess over Pap1. The apparent maximal velocity was determined to be 102.3 min−1 (± 4%), the apparent velocity of the PAP-Fip220 complex is 60.6 min−1 (± 16%), and the Kd is 4.4 pM (± 126%).
Figure 5
Figure 5. Sequence alignments between yeast and human Pap1 and Fip1
A) Pap1 structure-based sequence alignment. Residues contacting Fip1 are colored red. To distinguish these from other functionally-important residues, residues involved in Mg-ATP binding have been highlighted in yellow and those shown to bind RNA are highlighted in magenta. Arrows denote the two residues mutated to abrogate Fip1 binding. Residues shown in grey are in significantly different conformations in structures of yeast and bovine PAP. Any sequence conservation within these regions is unlikely to be of functional significance. B) Fip1 alignment. The region corresponding to the Fippbd is colored grey, with those residues contacting Pap1 colored magenta. The entire length of each sequence is shown to highlight the lack of sequence conservation in the region corresponding to our peptide.

References

    1. Zhao J, Hyman L, Moore C. Formation of mRNA 3′ ends in eukaryotes: mechanism, regulation, and interrelationships with other steps in mRNA synthesis. Microbiol Mol Biol Rev. 1999;63:405–445. - PMC - PubMed
    1. Gilmartin GM. Eukaryotic mRNA 3′ processing: a common means to different ends. Genes & development. 2005;19:2517–2521. - PubMed
    1. Aravind L, Koonin EV. DNA polymerase beta-like nucleotidyltransferase superfamily: identification of three new families, classification and evolutionary history. Nucleic acids research. 1999;27:1609–1618. - PMC - PubMed
    1. Bard J, Zhelkovsky AM, Helmling S, Earnest TN, Moore CL, Bohm A. Structure of yeast poly(A) polymerase alone and in complex with 3′-dATP. Science. 2000;289:1346–1349. - PubMed
    1. Martin G, Keller W, Doublie S. Crystal structure of mammalian poly(A) polymerase in complex with an analog of ATP. The EMBO journal. 2000;19:4193–4203. - PMC - PubMed

Publication types

MeSH terms

Substances