

Mouse breathalyzer
- PMID: 18537938
- PMCID: PMC2528953
- DOI: 10.1111/j.1530-0277.2008.00737.x
Mouse breathalyzer
Abstract
Background: The development of a relatively simple, noninvasive method for estimating blood ethanol concentrations in mice will be useful in behavioral studies related to alcoholism. This study validated such a method.
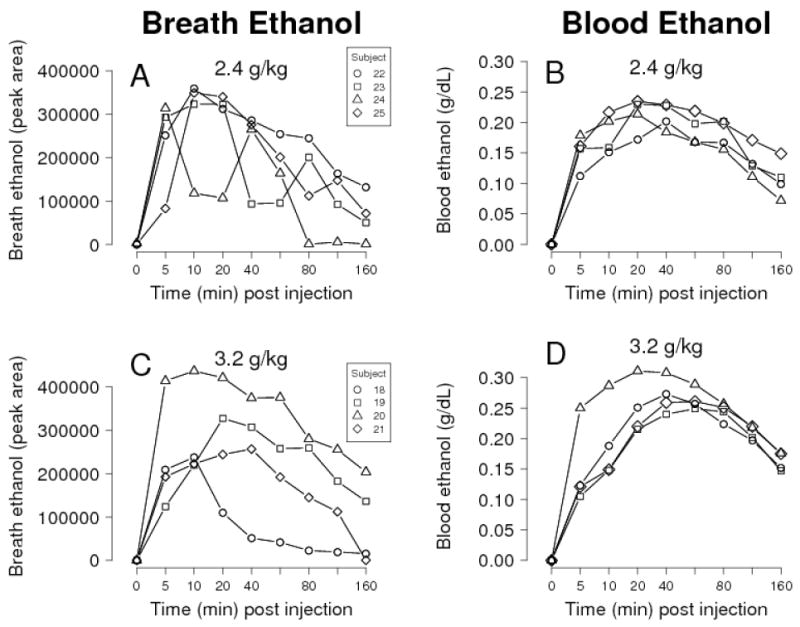
Methods: The apparatus consists of a body chamber fitted with a head stock through which the mouse head protrudes. This was fitted against a water-jacketed head-space chamber surrounding the mouse's head. Rebreathed air maintained at 37 degrees C in the head-space chamber was removed using a peristaltic pump and loaded into a 1-ml injection loop. Ethanol in the sample was quantified using gas chromatography. To validate this method, ethanol levels in breath samples were compared against those in tail blood samples collected immediately after the breath samples. Breath samples were collected at 5, 10, 20, 40, 80, 120, and 160 minutes after ethanol (0.4, 0.8, 1.2, 1.6, 2.4, and 3.2 g/kg) was administered to male C57BL/6J mice.
Results: Breath and blood ethanol levels were well correlated (r(2) = 0.96) across time points on the descending ethanol-time curve at doses below 2.4 g/kg. Correlation for these doses on the ascending portion of the curve had greater variance, but was still well correlated (r(2) = 0.92).
Conclusions: The mouse breathalyzer is an accurate, convenient, noninvasive and well-tolerated method for estimating blood ethanol concentrations in mice across a range of behaviorally relevant concentrations below 2.4 g/kg, especially on the descending limb of the ethanol-time curve. Although this procedure requires a gas chromatograph in the animal facility, the ability to estimate ethanol concentrations quickly and easily will be especially useful in behavioral studies where repeated blood sampling is not feasible.
Figures


References
-
- Abel EL. Behavioral Teratology of alcohol (animal model studies of the fetal alcohol syndrome) In: Abel EL, editor. Fetal alcohol syndrome, Vol III. Animal Studies. CRC Press; Boca Raton, FL: 1982. pp. 59–81.
-
- Becker HC, Baros AM. Effect of duration and pattern of chronic ethanol exposure on tolerance to the discriminative stimulus effects of ethanol in c57bl/6j mice. J Pharmacol Exp Ther. 2006;319:871–878. - PubMed
-
- Fioriglio C, Wood J, Hartline RA, Schneider CW. A quantitative analysis of ethanol and acetaldehyde expired by inbred mouse strains. Pharmacol Biochem Behav. 1980;12:467–469. - PubMed
-
- Gentry RT, Rappaport MS, Dole VP. Elevated concentrations of ethanol in plasma do not suppress voluntary ethanol consumption in c57bl mice. Alcohol Clin Exp Res. 1983;7:420–423. - PubMed
-
- Giles HG, Sandrin S, Saldivia V. Noninvasive estimation of blood alcohol concentrations by eye vapor analysis using an electrochemical fuel cell detector. Alcohol Clin Exp Res. 1989;13:461–464. - PubMed
Publication types
MeSH terms
Substances
Grants and funding
LinkOut - more resources
Full Text Sources
Other Literature Sources
