

Pharmacokinetics of intravenous and oral midazolam in plasma and saliva in humans: usefulness of saliva as matrix for CYP3A phenotyping
- PMID: 18537963
- PMCID: PMC2561102
- DOI: 10.1111/j.1365-2125.2008.03201.x
Pharmacokinetics of intravenous and oral midazolam in plasma and saliva in humans: usefulness of saliva as matrix for CYP3A phenotyping
Abstract
Aims: To compare midazolam kinetics between plasma and saliva and to find out whether saliva is suitable for CYP3A phenotyping.
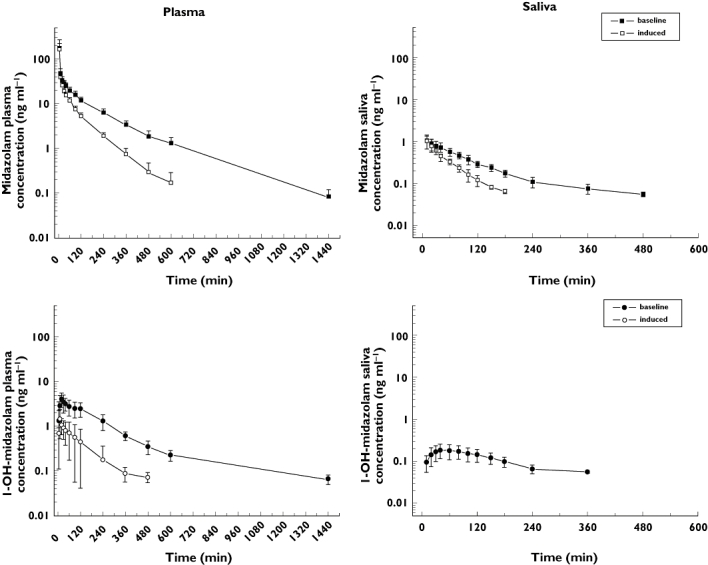
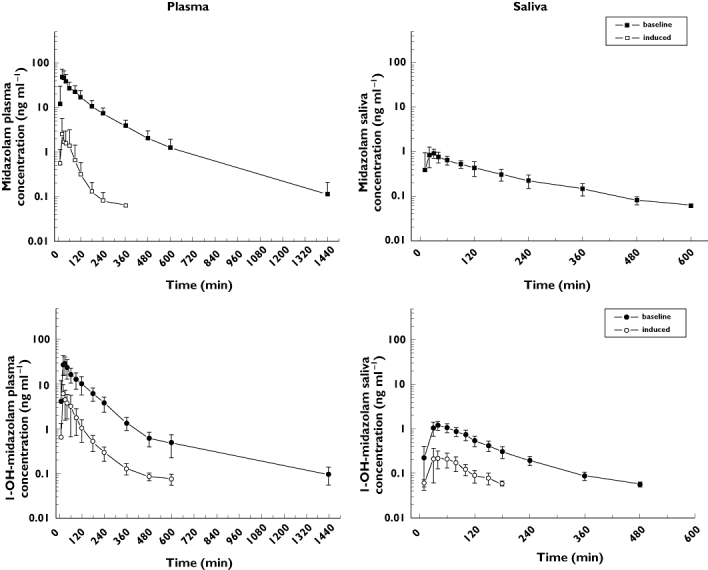
Methods: This was a two way cross-over study in eight subjects treated with 2 mg midazolam IV or 7.5 mg orally under basal conditions and after CYP3A induction with rifampicin.
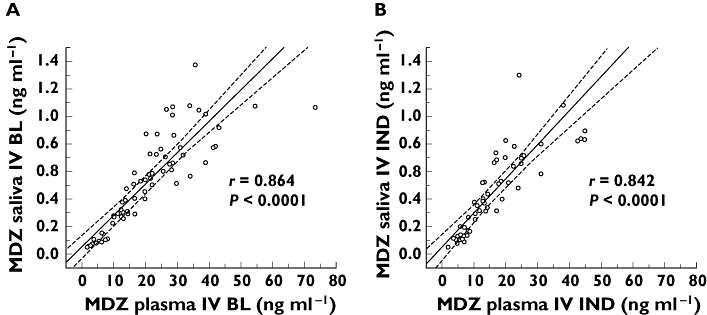
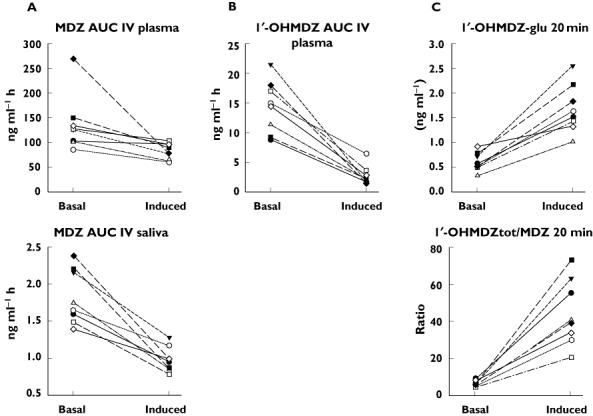
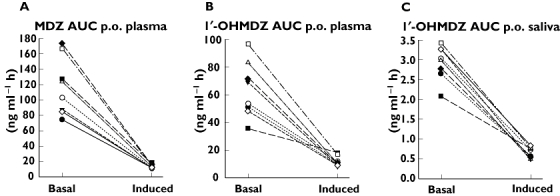
Results: Under basal conditions and IV administration, midazolam and 1'-hydroxymidazolam (plasma, saliva), 4-hydroxymidazolam and 1'-hydroxymidazolam-glucuronide (plasma) were detectable. After rifampicin, the AUC of midazolam [mean differences plasma 53.7 (95% CI 4.6, 102.9) and saliva 0.83 (95% CI 0.52, 1.14) ng ml(-1) h] and 1'-hydroxymidazolam [mean difference plasma 11.8 (95% CI 7.9 , 15.7) ng ml(-1) h] had decreased significantly. There was a significant correlation between the midazolam concentrations in plasma and saliva (basal conditions: r = 0.864, P < 0.0001; after rifampicin: r = 0.842, P < 0.0001). After oral administration and basal conditions, midazolam, 1'-hydroxymidazolam and 4-hydroxymidazolam were detectable in plasma and saliva. After treatment with rifampicin, the AUC of midazolam [mean difference plasma 104.5 (95% CI 74.1, 134.9) ng ml(-1) h] and 1'-hydroxymidazolam [mean differences plasma 51.9 (95% CI 34.8, 69.1) and saliva 2.3 (95% CI 1.9, 2.7) ng ml(-1) h] had decreased significantly. The parameters separating best between basal conditions and post-rifampicin were: (1'-hydroxymidazolam + 1'-hydroxymidazolam-glucuronide)/midazolam at 20-30 min (plasma) and the AUC of midazolam (saliva) after IV, and the AUC of midazolam (plasma) and of 1'-hydroxymidazolam (plasma and saliva) after oral administration.
Conclusions: Saliva appears to be a suitable matrix for non-invasive CYP3A phenotyping using midazolam as a probe drug, but sensitive analytical methods are required.
Figures
Similar articles
-
The area under the plasma concentration-time curve for oral midazolam is 400-fold larger during treatment with itraconazole than with rifampicin.Eur J Clin Pharmacol. 1998 Mar;54(1):53-8. doi: 10.1007/s002280050420. Eur J Clin Pharmacol. 1998. PMID: 9591931 Clinical Trial.
-
Probe of CYP3A by a single-point blood measurement after oral administration of midazolam in healthy elderly volunteers.Eur J Clin Pharmacol. 2006 Aug;62(8):653-9. doi: 10.1007/s00228-006-0159-2. Epub 2006 Jul 11. Eur J Clin Pharmacol. 2006. PMID: 16832678 Clinical Trial.
-
Proposal of a new limited sampling strategy to predict CYP3A activity using a partial AUC of midazolam.Eur J Clin Pharmacol. 2010 Nov;66(11):1137-41. doi: 10.1007/s00228-010-0878-2. Epub 2010 Aug 3. Eur J Clin Pharmacol. 2010. PMID: 20680253
-
Effect of saquinavir-ritonavir on cytochrome P450 3A4 activity in healthy volunteers using midazolam as a probe.Pharmacotherapy. 2009 Oct;29(10):1175-81. doi: 10.1592/phco.29.10.1175. Pharmacotherapy. 2009. PMID: 19792991
-
Value of Assessing 1-Hydroxymidazolam in Drug-Drug Interaction Studies with Midazolam as a Substrate of Cytochrome P450 3A.J Clin Pharmacol. 2024 Sep;64(9):1123-1129. doi: 10.1002/jcph.2447. Epub 2024 May 26. J Clin Pharmacol. 2024. PMID: 38797881 Review.
Cited by
-
A clinical study to assess CYP1A2 and CYP3A4 induction by AZD7325, a selective GABA(A) receptor modulator - an in vitro and in vivo comparison.Br J Clin Pharmacol. 2012 Jul;74(1):98-108. doi: 10.1111/j.1365-2125.2011.04155.x. Br J Clin Pharmacol. 2012. PMID: 22122233 Free PMC article.
-
Effect of the inhibition of CYP3A4 or CYP2D6 on the pharmacokinetics and pharmacodynamics of oxycodone.Eur J Clin Pharmacol. 2011 Jan;67(1):63-71. doi: 10.1007/s00228-010-0893-3. Epub 2010 Sep 21. Eur J Clin Pharmacol. 2011. PMID: 20857093 Clinical Trial.
-
Effects of Cytochrome P450 Inhibition and Induction on the Phenotyping Metrics of the Basel Cocktail: A Randomized Crossover Study.Clin Pharmacokinet. 2016 Jan;55(1):79-91. doi: 10.1007/s40262-015-0294-y. Clin Pharmacokinet. 2016. PMID: 26123704 Free PMC article. Clinical Trial.
-
CYP3A4-mediated effects of rifampicin on the pharmacokinetics of vilaprisan and its UGT1A1-mediated effects on bilirubin glucuronidation in humans.Br J Clin Pharmacol. 2018 Dec;84(12):2857-2866. doi: 10.1111/bcp.13750. Epub 2018 Oct 11. Br J Clin Pharmacol. 2018. PMID: 30171692 Free PMC article.
-
Validation of 4β-hydroxycholesterol and evaluation of other endogenous biomarkers for the assessment of CYP3A activity in healthy subjects.Br J Clin Pharmacol. 2014 Nov;78(5):1122-34. doi: 10.1111/bcp.12425. Br J Clin Pharmacol. 2014. PMID: 24837659 Free PMC article. Clinical Trial.
References
-
- Nordt SP, Clark RF. Midazolam: a review of therapeutic uses and toxicity. J Emerg Med. 1997;15:357–65. - PubMed
-
- Streetman DS, Bertino JS, Jr, Nafziger AN. Phenotyping of drug-metabolizing enzymes in adults: a review of in-vivo cytochrome P450 phenotyping probes. Pharmacogenetics. 2000;10:187–216. - PubMed
-
- Bauer TM, Ritz R, Haberthur C, Ha HR, Hunkeler W, Sleight AJ, Scollo-Lavizzari G, Haefeli WE. Prolonged sedation due to accumulation of conjugated metabolites of midazolam. Lancet. 1995;346:145–7. - PubMed
-
- Heizmann P, Ziegler WH. Excretion and metabolism of 14C-midazolam in humans following oral dosing. Arzneimittelforschung. 1981;31:2220–3. - PubMed
-
- Kronbach T, Mathys D, Umeno M, Gonzalez FJ, Meyer UA. Oxidation of midazolam and triazolam by human liver cytochrome P450IIIA4. Mol Pharmacol. 1989;36:89–96. - PubMed
Publication types
MeSH terms
Substances
LinkOut - more resources
Full Text Sources
Other Literature Sources
