

Flexible boosting of accelerated failure time models
- PMID: 18538026
- PMCID: PMC2453145
- DOI: 10.1186/1471-2105-9-269
Flexible boosting of accelerated failure time models
Abstract
Background: When boosting algorithms are used for building survival models from high-dimensional data, it is common to fit a Cox proportional hazards model or to use least squares techniques for fitting semiparametric accelerated failure time models. There are cases, however, where fitting a fully parametric accelerated failure time model is a good alternative to these methods, especially when the proportional hazards assumption is not justified. Boosting algorithms for the estimation of parametric accelerated failure time models have not been developed so far, since these models require the estimation of a model-specific scale parameter which traditional boosting algorithms are not able to deal with.
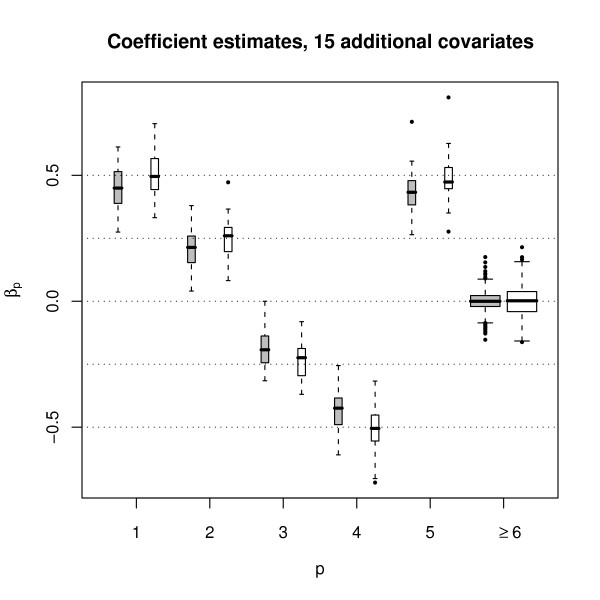
Results: We introduce a new boosting algorithm for censored time-to-event data which is suitable for fitting parametric accelerated failure time models. Estimation of the predictor function is carried out simultaneously with the estimation of the scale parameter, so that the negative log likelihood of the survival distribution can be used as a loss function for the boosting algorithm. The estimation of the scale parameter does not affect the favorable properties of boosting with respect to variable selection.
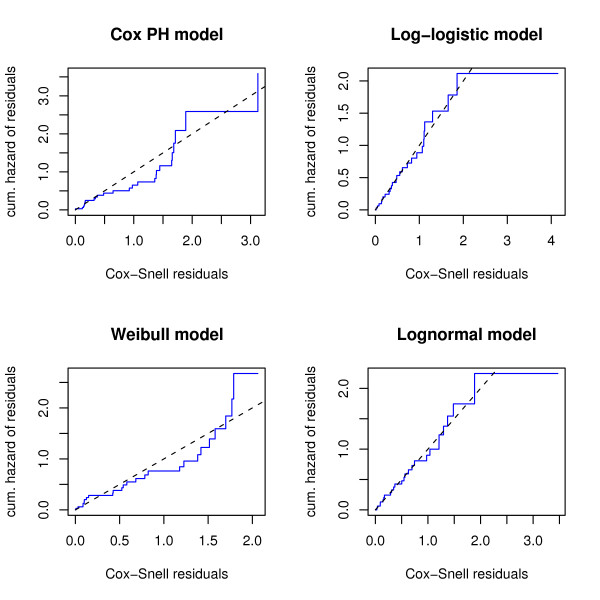
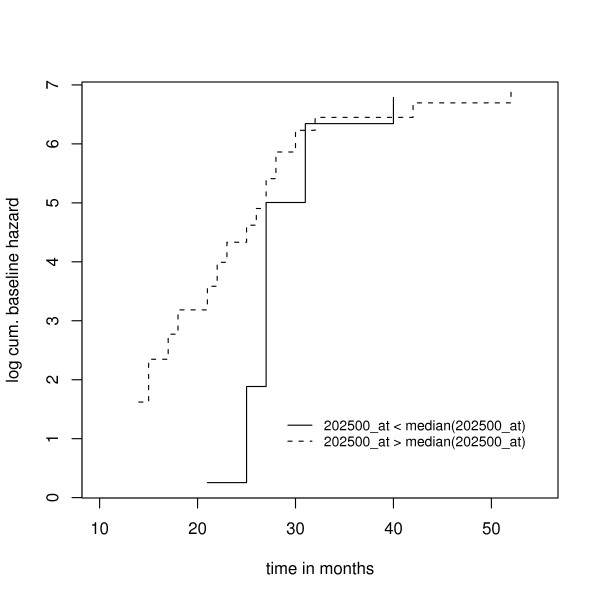
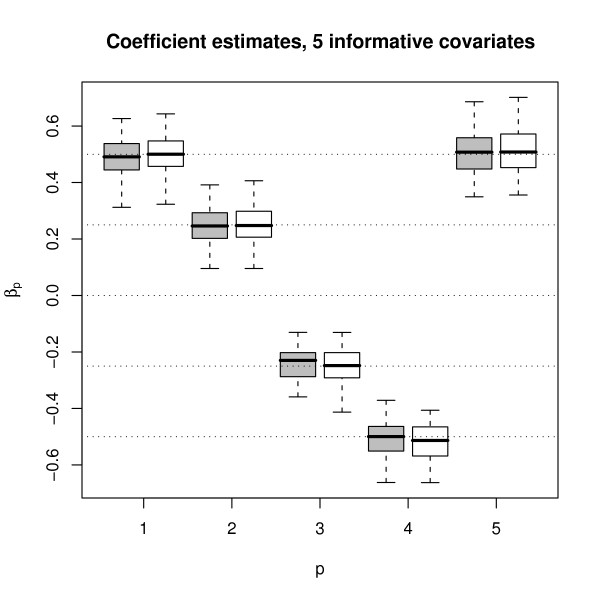
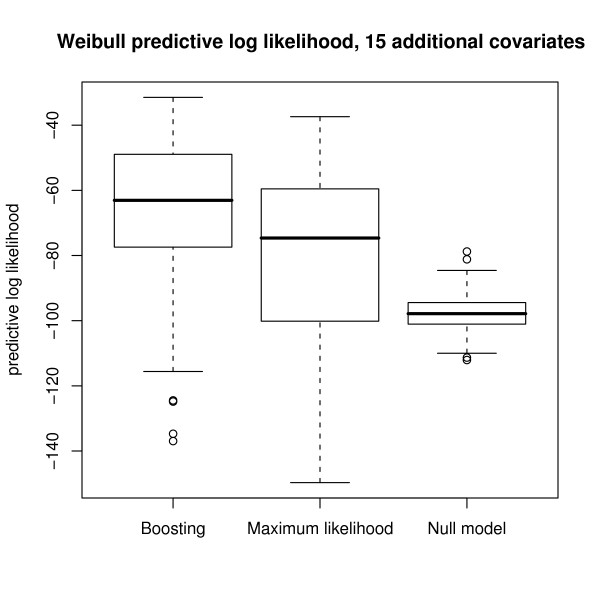
Conclusion: The analysis of a high-dimensional set of microarray data demonstrates that the new algorithm is able to outperform boosting with the Cox partial likelihood when the proportional hazards assumption is questionable. In low-dimensional settings, i.e., when classical likelihood estimation of a parametric accelerated failure time model is possible, simulations show that the new boosting algorithm closely approximates the estimates obtained from the maximum likelihood method.
Figures
Similar articles
-
Scalable algorithms for semiparametric accelerated failure time models in high dimensions.Stat Med. 2022 Mar 15;41(6):933-949. doi: 10.1002/sim.9264. Epub 2022 Jan 11. Stat Med. 2022. PMID: 35014701
-
On hazard-based penalized likelihood estimation of accelerated failure time model with partly interval censoring.Stat Methods Med Res. 2020 Dec;29(12):3804-3817. doi: 10.1177/0962280220942555. Epub 2020 Jul 20. Stat Methods Med Res. 2020. PMID: 32689908
-
On semiparametric accelerated failure time models with time-varying covariates: A maximum penalised likelihood estimation.Stat Med. 2023 Dec 30;42(30):5577-5595. doi: 10.1002/sim.9926. Epub 2023 Oct 16. Stat Med. 2023. PMID: 37845791
-
Extending statistical boosting. An overview of recent methodological developments.Methods Inf Med. 2014;53(6):428-35. doi: 10.3414/ME13-01-0123. Epub 2014 Aug 12. Methods Inf Med. 2014. PMID: 25112429 Review.
-
An Update on Statistical Boosting in Biomedicine.Comput Math Methods Med. 2017;2017:6083072. doi: 10.1155/2017/6083072. Epub 2017 Aug 2. Comput Math Methods Med. 2017. PMID: 28831290 Free PMC article. Review.
Cited by
-
Review of statistical methods for survival analysis using genomic data.Genomics Inform. 2019 Dec;17(4):e41. doi: 10.5808/GI.2019.17.4.e41. Epub 2019 Dec 20. Genomics Inform. 2019. PMID: 31896241 Free PMC article.
-
Integrative analysis of multiple cancer prognosis studies with gene expression measurements.Stat Med. 2011 Dec 10;30(28):3361-71. doi: 10.1002/sim.4337. Epub 2011 Aug 25. Stat Med. 2011. PMID: 22105693 Free PMC article.
-
Predicting survival times for neuroblastoma patients using RNA-seq expression profiles.Biol Direct. 2018 May 30;13(1):11. doi: 10.1186/s13062-018-0213-x. Biol Direct. 2018. PMID: 29848365 Free PMC article.
-
Identification of Breast Cancer Prognosis Markers via Integrative Analysis.Comput Stat Data Anal. 2012 Sep 1;56(9):2718-2728. doi: 10.1016/j.csda.2012.02.017. Comput Stat Data Anal. 2012. PMID: 22773869 Free PMC article.
-
Integrative analysis of cancer prognosis data with multiple subtypes using regularized gradient descent.Genet Epidemiol. 2012 Dec;36(8):829-38. doi: 10.1002/gepi.21669. Epub 2012 Jul 31. Genet Epidemiol. 2012. PMID: 22851516 Free PMC article.
References
-
- Cox DR. Regression Models and Life Tables (with Discussion) Journal of the Royal Statistical Society, Series B. 1972;34:187–220.
-
- James I. Accelerated Failure-Time Models. In: Armitage P, Colton T, editor. Encyclopedia of Biostatistics. John Wiley & Sons, Chichester; 1998. pp. 26–30.
-
- Park MY, Hastie T. L1-Regularization Path Algorithm for Generalized Linear Models. Journal of the Royal Statistical Society, Series B. 2007;69:659–677. doi: 10.1111/j.1467-9868.2007.00607.x. - DOI
Publication types
MeSH terms
LinkOut - more resources
Full Text Sources
