. 2008 Jul 4;26(29-30):3662-72.
doi: 10.1016/j.vaccine.2008.04.069. Epub 2008 May 16.

Enhancement of immunostimulatory properties of exosomal vaccines by incorporation of fusion-competent G protein of vesicular stomatitis virus

Affiliations

Enhancement of immunostimulatory properties of exosomal vaccines by incorporation of fusion-competent G protein of vesicular stomatitis virus

Vladimir V Temchura et al. Vaccine. .

Abstract

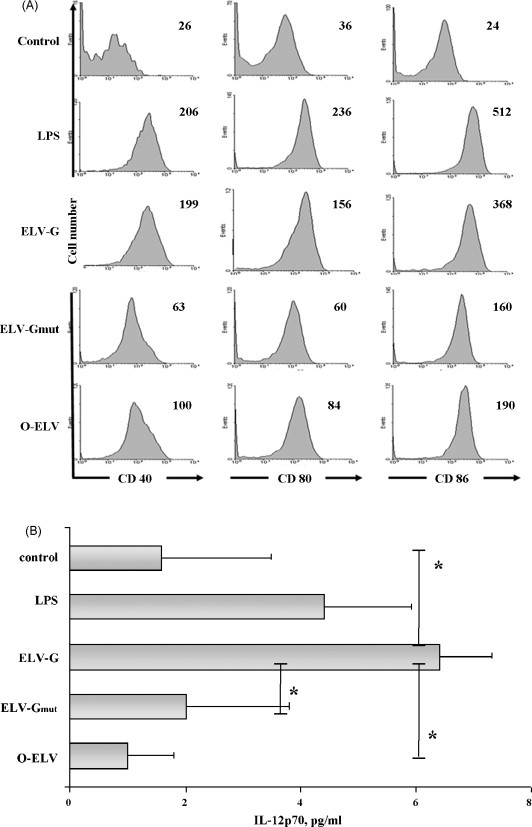
Exosomes have been proposed as candidates for therapeutic immunization. The present study demonstrates that incorporation of the G protein of vesicular stomatitis virus (VSV-G) into exosome-like vesicles (ELVs) enhances their uptake and induces the maturation of dendritic cells. Targeting of VSV-G and ovalbumin as a model antigen to the same ELVs increased the cross-presentation of ovalbumin via an endosomal acidification mechanism. Immunization of mice with VSV-G and ovalbumin containing ELVs led to an increased IgG2a antibody response, expansion of antigen-specific CD8 T cells, strong in vivo CTL responses, and protection from challenge with ovalbumin expressing tumor cells. Thus, incorporation of VSV-G and targeting of antigens to ELVs are attractive strategies to improve exosomal vaccines.


Figures

Fig. 1
Fig. 1
Characterization of membrane-anchored OVA and fusion-defective VSV-G proteins. (A) Schematic drawing of chimeric OVA/VSV-G protein. Open box represents OVA; gray boxes, VSV-G. LP: leader peptide; TM: transmembrane domain; CD: cytoplasmic domain. (B) FACS analysis of 293T cells transfected with the expression plasmid for either pExOVA or pSolOVA and stained 2 days later for the presence of the OVA protein at the cell surface. Untransfected cells were used as negative control. (C) The 293T cells were transfected with either the pCD-Gsyn plasmid encoding VSV-G or the pCD-Gmut plasmid encoding fusion-defective VSV-G. The cell lysates were analyzed by Western blot for the presence of VSV-G. (D) The pCD-Gsyn or pCD-Gmut plasmids were co-transfected with a GFP expression plasmid. Two days later transfected cells were incubated with a low-pH fusion buffer and monitored over time under a fluorescence microscope for the presence of syncytia formation. The pictures were taken 1 h after addition of the buffer. Cells transfected with the GFP expression plasmid only served as negative control (Mock).
Fig. 2
Fig. 2
Characterization of the ELVs. (A) 293T cells were transfected with either pExOVA or pSolOVA plasmids. Cells lysate (Lysate) and the pellet obtained by ultracentrifugation of the conditioned media (Pellet) were analyzed for the presence of the OVA proteins by Western blot analysis. Mock-transfected cells were used as negative controls. (B) The conditioned media from 293T cells transfected with the pExOVA plasmid was loaded onto a step gradient of sucrose with the indicated sucrose concentration and ultracentrifuged. The different sucrose fractions were collected and analyzed by Western blot for the presence of the OVA protein (upper panel) and the HSP90 protein (lower panel).
Fig. 3
Fig. 3
Uptake experiment. Ten micrograms of different CFDA-labeled ELVs (ELV-G, ELV-Gmut or O-ELV) were incubated with cell suspension enriched for CD11c+ cells. Cells were incubated for the indicated time at 37 °C or on ice, washed, and stained with anti-CD11c antibody. The results are presented as an uptake index = (MFI at 37 °C/MFI ice) for CD11c-positive (A) and CD11c-negative (B) cells. The experiment was performed three times; data represent the mean ± standard deviation. Statistically significant difference (*p < 0.05) to the ELV-G group.
Fig. 4
Fig. 4
Activation of splenic DC by ELVs. (A) Freshly isolated splenic DC were incubated with LPS (1 μg/ml) or with 10 μg/ml of ELVs (ELV-G, ELV-Gmut or O-ELV) for 24 h. Cells were collected and stained for MHC II, CD11c, CD40, CD80, and CD86. CD11c+MHCII+ cells were analyzed for CD40, CD80, and CD86 expression levels by flow cytometry. Numbers indicated in the upper right of the histograms represent the Geometric log MFI. One representative experiment of three is shown. (B) Cell-free supernatants were analyzed in triplicate for the presence of IL-12p70 (pg/ml) by ELISA. Data present the mean from three independent experiments ± standard deviation. *p < 0.05.
Fig. 5
Fig. 5
Cross-presentation of ELV targeted OVA to OVA-specific CD8+ cells. DC were incubated with soluble OVA at a concentration of 0.01 μg/ml (A) and 1 μg/ml (B) or with O-ELV (C), O-ELV-Gmut (D), or O-EVL-G (E) vesicles each containing 0.01 μg/ml of OVA. DC were also incubated with mixtures of separately prepared ELV-G or ELV-Gmut and O-ELV containing 0.01 μg/ml of OVA (F/H, respectively), or ELV-G or ELV-Gmut and 0.01 μg/μl of soluble OVA (G/I, respectively). After 2 h of incubation, DC were washed and mixed with CFDA-labeled CD8+ T cells from spleens of OT-1 mice. Ninety-six hours later, cells were washed and stained with APC-conjugated H-2Kb/OVA257–264 tetramers. The proliferation of tetramer-positive OT-1 CD8+ T cells was evaluated by flow cytometry analysis for CFDA fluorescence intensity. The percentages of cells that have undergone more than two divisions are given. One representative out of three independent experiments is shown.
Fig. 6
Fig. 6
Intracellular processing pathway of O-ELV-G. Splenic DC were first pre-incubated for 1 h with Brefeldin A, lactacystin or ammonium chloride at the indicated concentrations and then pulsed for 2 h with 1 μg/ml of soluble OVA (sOVA1) or 0.01 μg/ml of OVA in O-ELV-G in the presence of the drugs mentioned above. Cells were then washed and co-cultured with CFDA-labeled OT-1 CD8+ T cells during 96 h. Histograms represent CFDA fluorescence intensity of H-2Kb/OVA257–264 tetramer-positive cells. The percentages of cells that have undergone more than two divisions are given. The results are representative of three independent experiments.
Fig. 7
Fig. 7
Characterization of the humoral immune responses. Serum samples were collected 1 week after the second immunization, analyzed by ELISA for the presence of anti-OVA IgG1 (A) or IgG2a (B) immunoglobulin subclasses at a 1:1000 and 1:10 dilution, respectively. The histograms represent the mean from two independent experiments ± standard deviation (n = 8). Statistically significant difference (*p < 0.05) to the control group; statistically significant difference (#p < 0.05) to sOVA group; statistically significant difference (§p < 0.005) to O-DNA group; statistically significant difference (p < 0.005) to O-ELV-Gmut group.
Fig. 8
Fig. 8
Characterization of the cellular immune responses. (A) Tetramer staining. One week after the second immunization, spleen cells were analyzed by FACS for the percentage of H-2Kb/OVA257–264 tetramer-positive CD8+ T cells. The histogram represents the mean from two independent experiments ± standard deviation (n = 8). Statistically significant difference (*p < 0.05) to control and sOVA groups; statistically significant difference (#p < 0.05) to O-DNA, O-ELV, and O-ELV-Gmut groups. (B) In vivo CTL assay. Representative FACS histograms of CFDAlo and OVA257–264 loaded CFDAhi populations in the spleen 16 h after cell transfer on day 7 after second immunization. The percent of specific killing is shown.
Fig. 9
Fig. 9
Tumor challenge. (A) Mice immunized with the indicated vaccines were challenged with B16-OVA cells 1 week after the second immunization. As an antigen-specific control, mice immunized with O-ELV-G were also challenged with B16 cells not expressing OVA (B16). The tumor growth was monitored daily and the volume was determined at 3-day interval. (B) The histogram represents the size of the tumor at day 18 after challenge as the mean from two independent experiments ± standard deviation. Statistically significant difference (*p < 0.01) to control, B16 and sOVA groups.

References

    1. Zitvogel L., Fernandez N., Lozier A., Wolfers J., Regnault A., Raposo G. Dendritic cells or their exosomes are effective biotherapies of cancer. Eur J Cancer. 1999;35(Suppl 3):36–38. - PubMed
    1. Andre F., Schartz N.E., Chaput N., Flament C., Raposo G., Amigorena S. Tumor-derived exosomes: a new source of tumor rejection antigens. Vaccine. 2002;20(Suppl 4):A28–A31. - PubMed
    1. Chaput N., Schartz N.E., Andre F., Taieb J., Novault S., Bonnaventure P. Exosomes as potent cell-free peptide-based vaccine. II. Exosomes in CpG adjuvants efficiently prime naive Tc1 lymphocytes leading to tumor rejection. J Immunol. 2004;172:2137–2146. - PubMed
    1. Taieb J., Chaput N., Zitvogel L. Dendritic cell-derived exosomes as cell-free peptide-based vaccines. Crit Rev Immunol. 2005;25:215–223. - PubMed
    1. Escudier B., Dorval T., Chaput N., André F., Caby M.P., Novault S. Vaccination of metastatic melanoma patients with autologous dendritic cell (DC) derived-exosomes: results of the first phase I clinical trial. J Transl Med. 2005;3:10. - PMC - PubMed

Publication types