. 2008 Jun 6;30(5):547-56.
doi: 10.1016/j.molcel.2008.04.023.

The RNA polymerase II trigger loop functions in substrate selection and is directly targeted by alpha-amanitin

Affiliations

The RNA polymerase II trigger loop functions in substrate selection and is directly targeted by alpha-amanitin

Craig D Kaplan et al. Mol Cell. .

Abstract

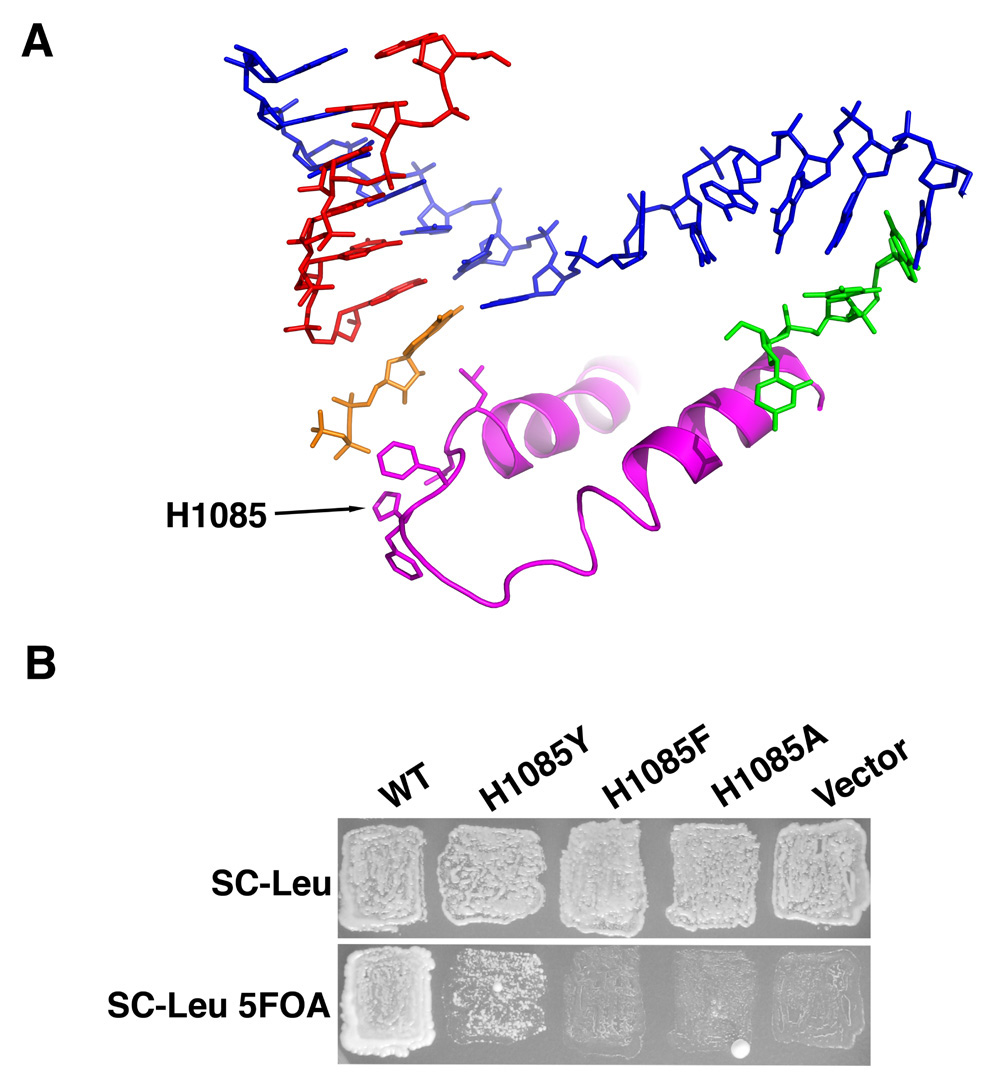
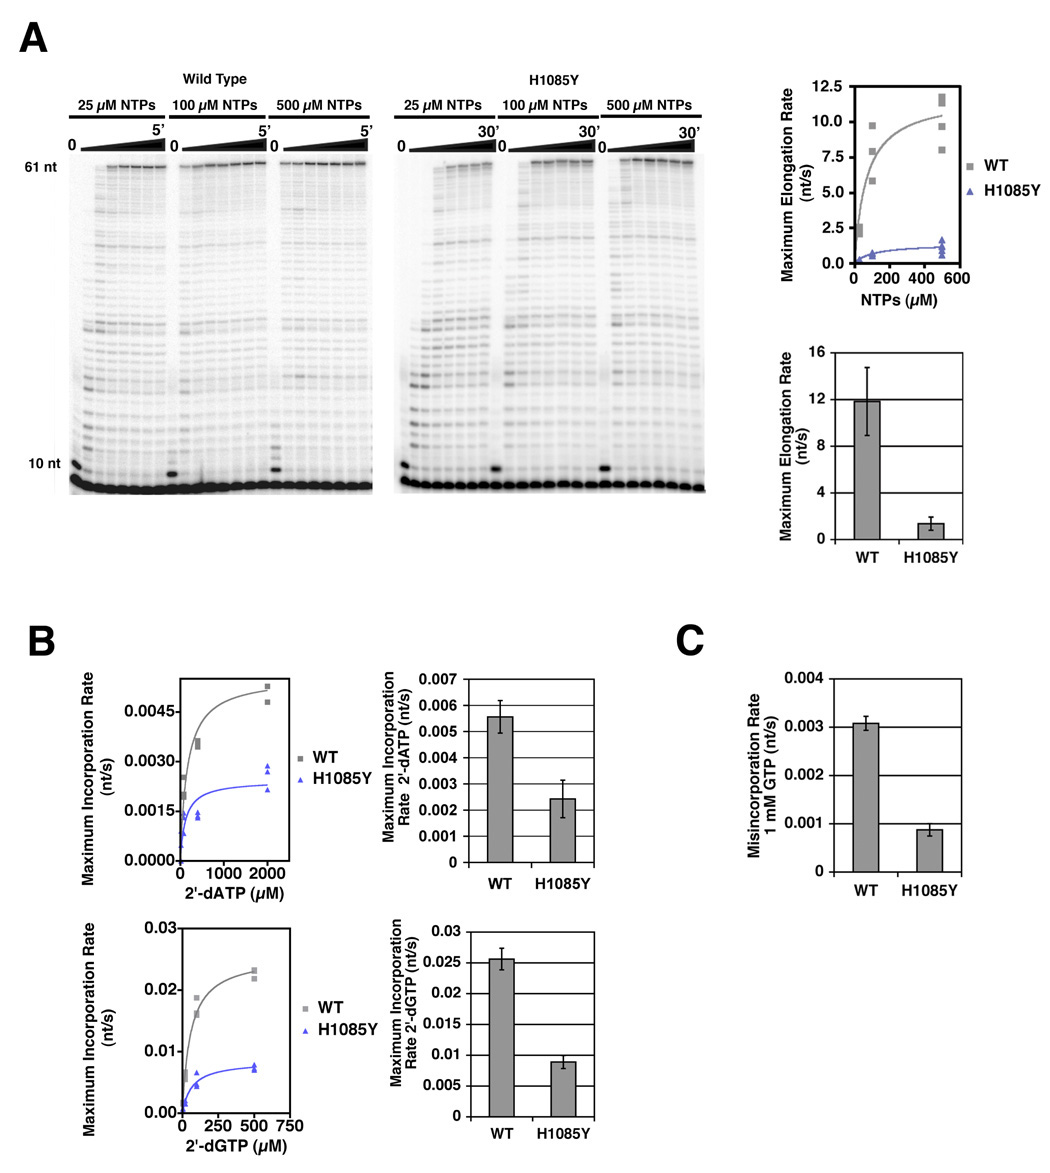
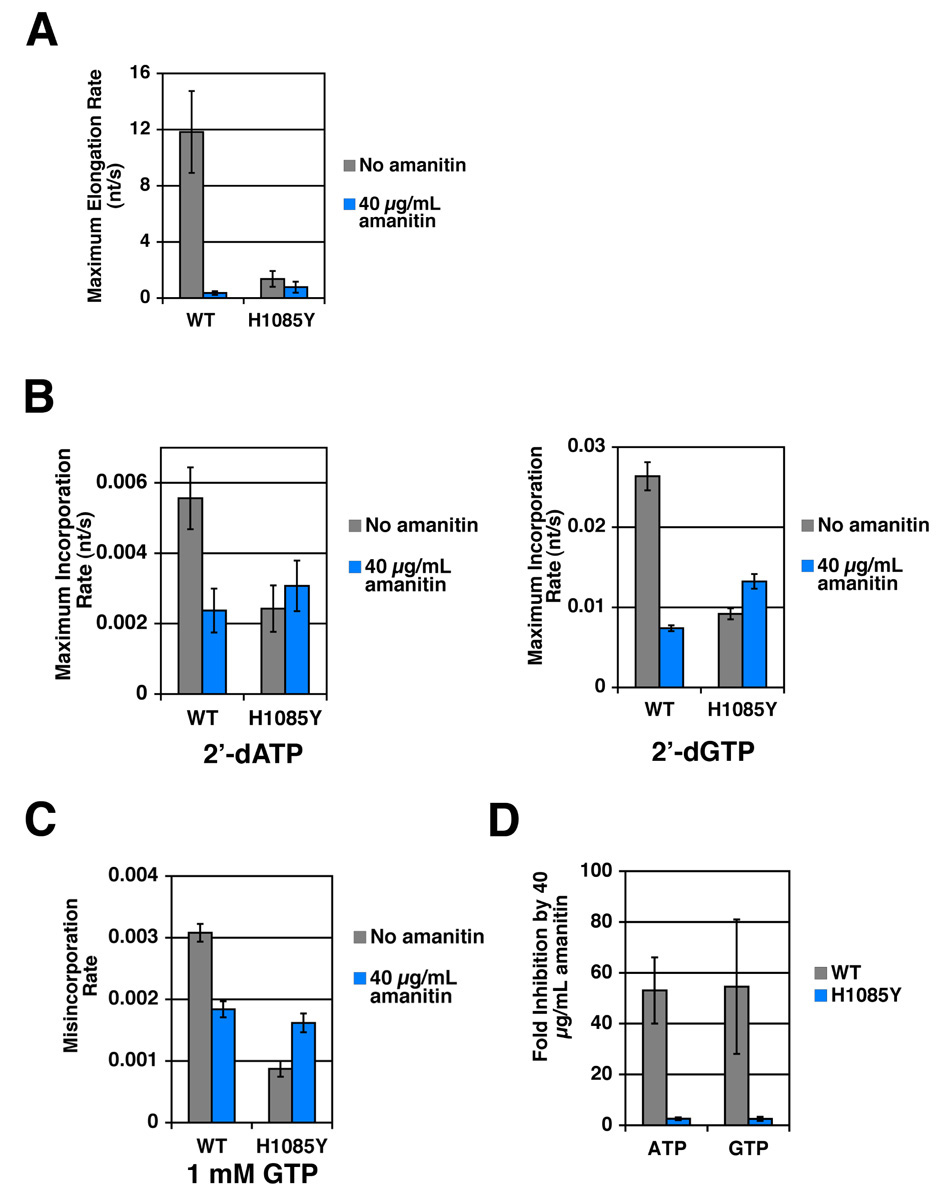
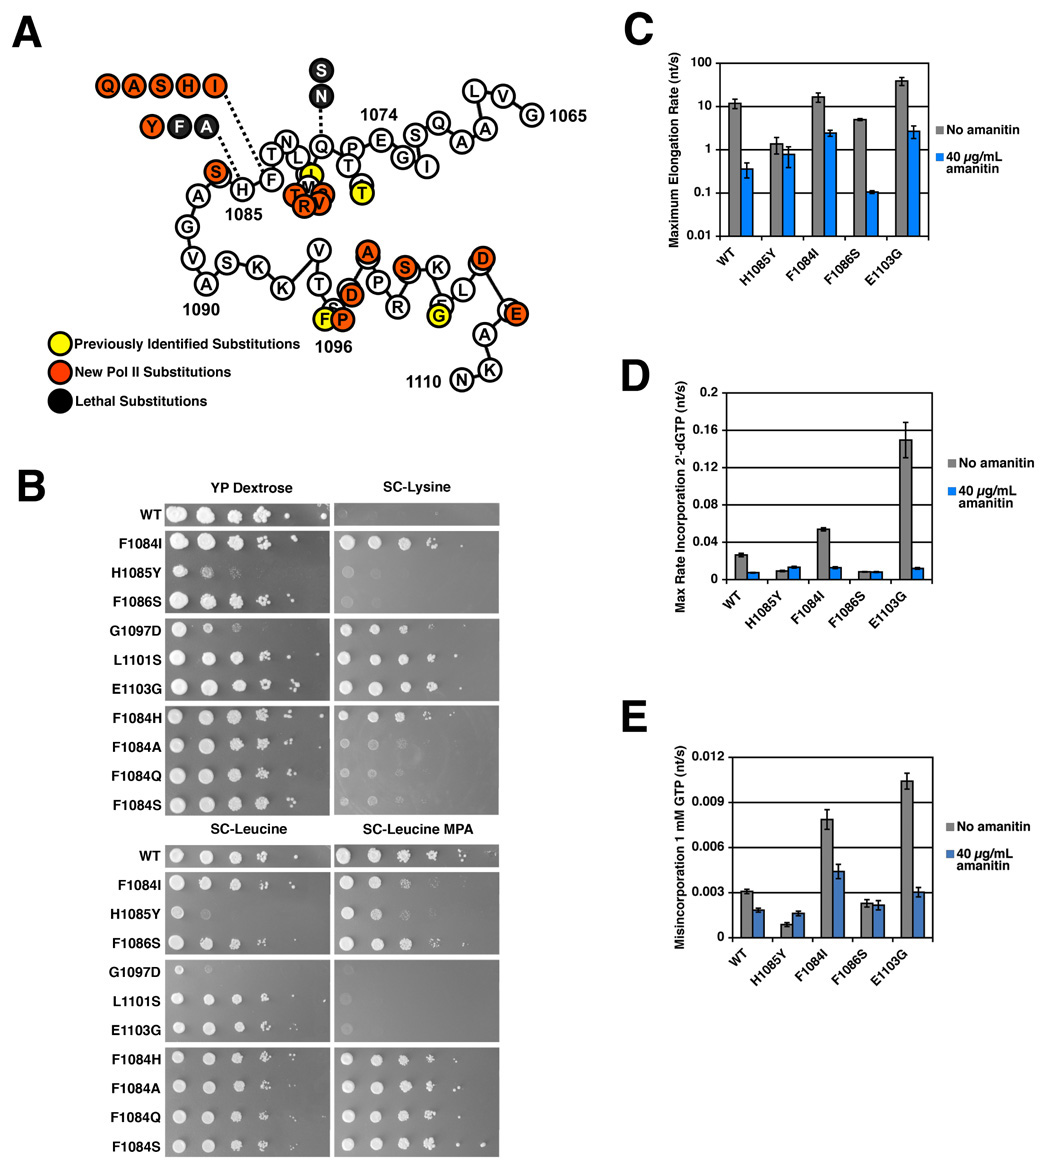
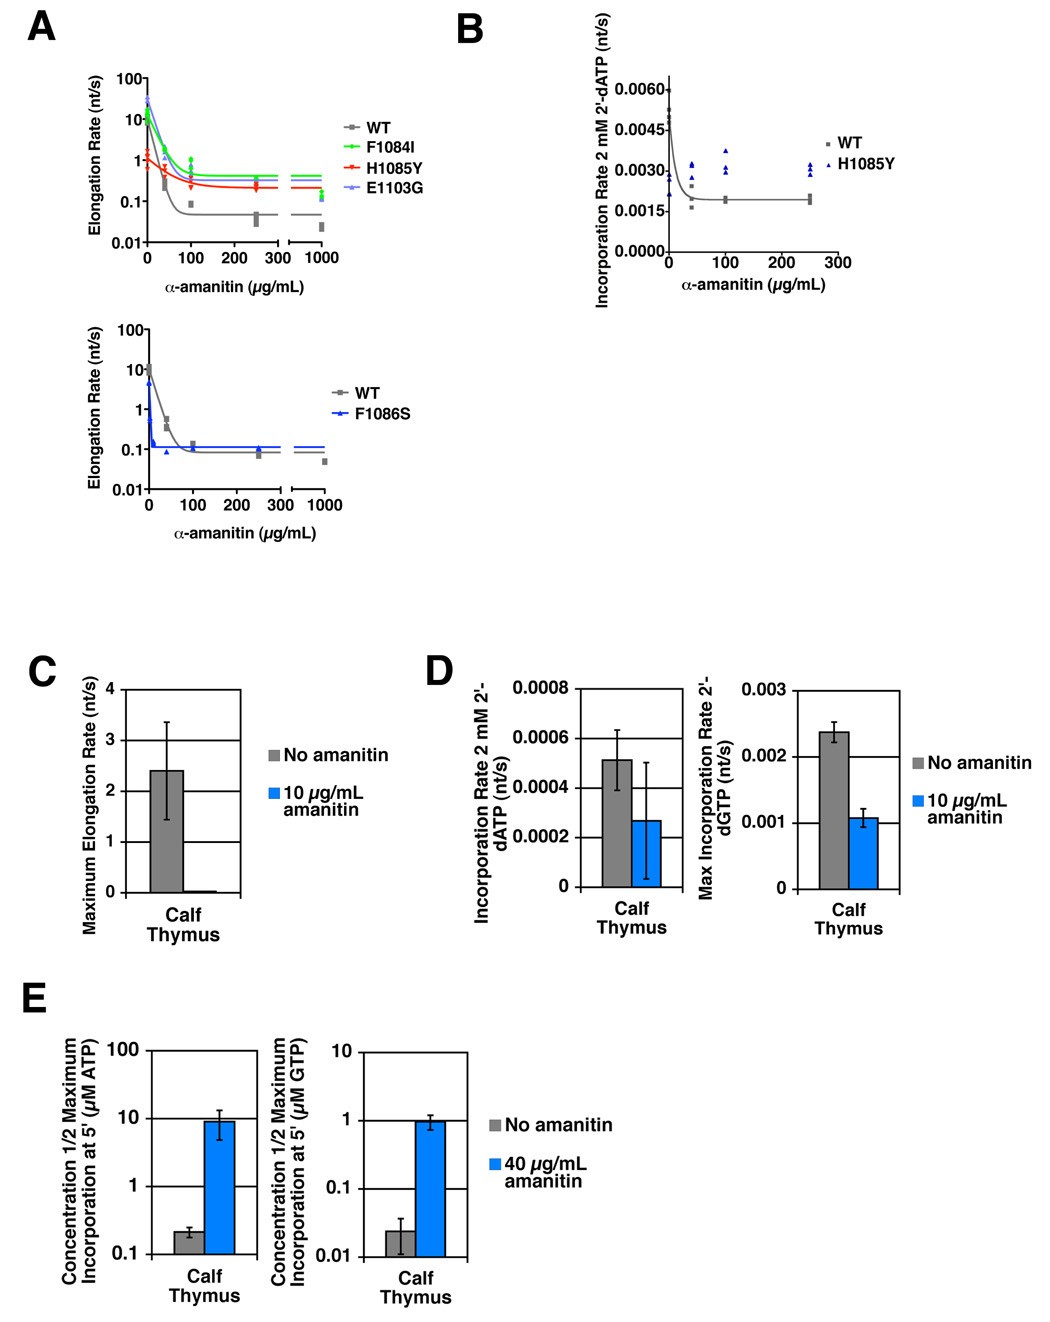
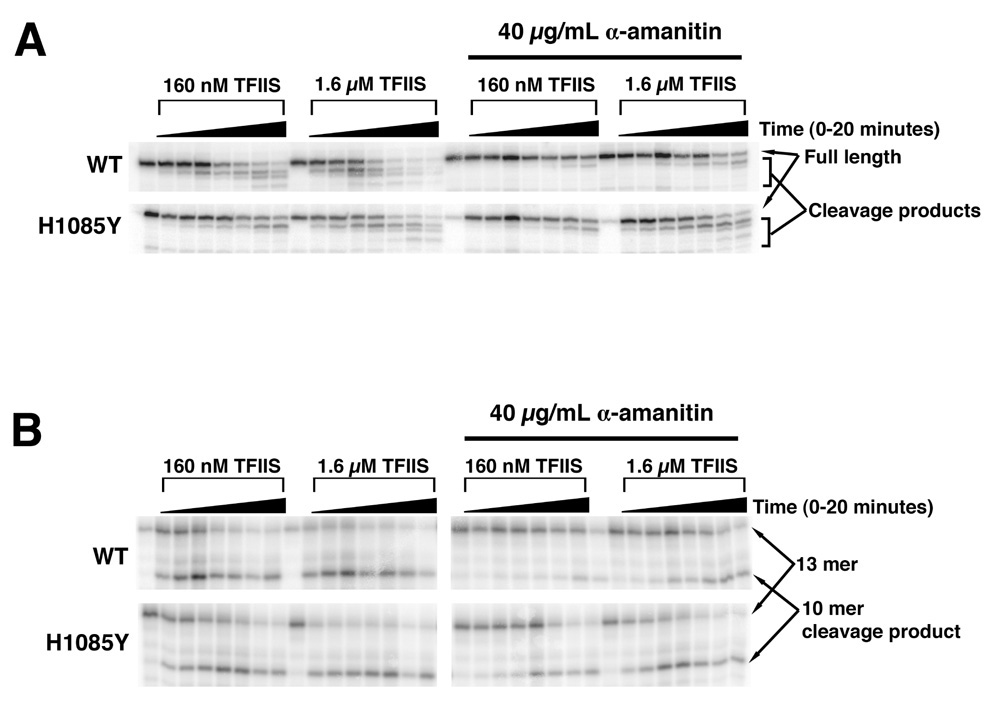
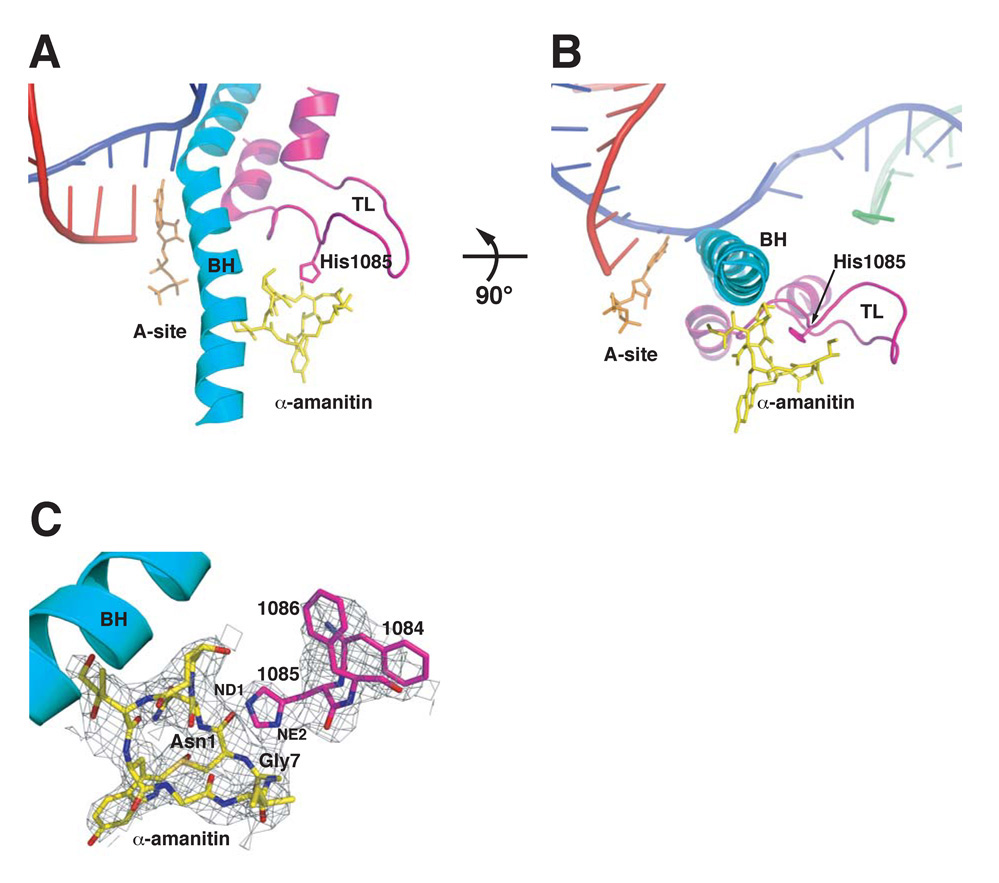
Structural, biochemical, and genetic studies have led to proposals that a mobile element of multisubunit RNA polymerases, the Trigger Loop (TL), plays a critical role in catalysis and can be targeted by antibiotic inhibitors. Here we present evidence that the Saccharomyces cerevisiae RNA Polymerase II (Pol II) TL participates in substrate selection. Amino acid substitutions within the Pol II TL preferentially alter substrate usage and enzyme fidelity, as does inhibition of transcription by alpha-amanitin. Finally, substitution of His1085 in the TL specifically renders Pol II highly resistant to alpha-amanitin, indicating a functional interaction between His1085 and alpha-amanitin that is supported by rerefinement of an alpha-amanitin-Pol II crystal structure. We propose that alpha-amanitin-inhibited Pol II elongation, which is slow and exhibits reduced substrate selectivity, results from direct alpha-amanitin interference with the TL.


Figures

Figure 1
Figure 1. Substitution of Rpb1 His1085 confers severe growth defects or lethality in vivo
A. Structural model of TL interaction with matched GTP in Pol II active site (PDB 2E2H)(Wang et al., 2006). TL residues Rpb1 1070–1105 (magenta) are shown together with a GTP substrate (orange), template DNA (blue), downstream non-template DNA (green) and RNA (red). Sidechains for some residues in the TL (Rpb1 1081–1082,1084–1086) are also shown. His1085 is positioned to interact with the β-phosphate of the GTP. B. Phenotypes of Rpb1 His1085 substitutions. In the absence of functional Rpb1, cells cannot lose an RPB1 plasmid marked with URA3. rpb1-H1085A and rpb1-H1085F plasmids fail to confer viability to an rpb1Δ strain, rendering cells sensitive to the drug 5-FOA because they have been forced to maintain an RPB1-URA3 plasmid for Rpb1 function (bottom row). rpb1-H1085Y can provide the sole source of Rpb1 function, but exhibits a severe growth defect.
Figure 2
Figure 2. Elongation Defects and Altered Substrate Selection by rpb1 H1085Y Pol II
A. H1085Y exhibits reduced elongation rate using NTP substrates. Run-off transcription of an oligonucleotide scaffold template generates a 61 nt RNA product. Representative experiments for WT and H1085Y Pol II are shown in the left and right panels, respectively. Average elongation rates for each NTP concentration were measured as the length of the transcribed region (51 nt) divided by the time of half-maximal accumulation of run-off product (61 nt). Average elongation rates were then plotted versus NTP concentration to infer maximum average elongation rate (see Experimental Procedures for details)(top right graph). Inferred maximum average elongation rates are shown in the bottom right graph with error bars representing the 95% confidence interval (See Experimental Procedures for details). B. H1085Y Pol II exhibits only modest defects for 2’-dNTP incorporation. WT and H1085Y Pol II ECs were formed on oligonucleotide scaffolds, containing 10-mer RNAs with templates specifying addition of different NTPs at position 11. Average incorporation rates for different template-specified 2’-dNTPs were measured as 1/t1/2 for maximal accumulation of 11-mer RNA. Incorporation rates were then plotted versus 2’-dNTP concentration and maximum incorporation rate for either 2’-dATP or 2’-dGTP was inferred (left panels). Maximum incorporation rates for WT Pol II and H1085Y are shown in the right panels with error bars representing the 95% confidence interval (See Experimental Procedures for details). C. H1085Y Pol II exhibits modest defects in GTP misincorporation. WT and H1085Y ECs were formed and labeled as in (B) with templates specifying incorporation of ATP at the position being measured, but were challenged with 1 mM GTP and misincorporation rate measured as the 1/t1/2 for maximal incorporation. Mean misincorporation rate from at least three experiments is represented in the bar graph (error bars represent +/− SD).
Figure 3
Figure 3. α-amanitin inhibition of WT Pol II is substrate selective, while H1085Y Pol II is mostly resistant to α-amanitin
A. α-amanitin inhibition of elongation by WT and H1085Y Pol II elongation complexes. Average elongation rate with NTP substrates for α-amanitin treated WT and H1085Y Pol II ECs determined exactly as in Figure 2A. RNA 10-mer containing ECs were formed as in Figure 2A but chased with equimolar NTPs at various concentrations in the presence of 40 µg/mL α-amanitin. Average elongation rates were then plotted versus NTP concentration and maximum average elongation rate inferred (Supplemental Figure 1A). Maximum average elongation rates are shown with error bars representing the 95% confidence interval of the mean. Untreated values are from Figure 2A and shown for comparison. B. Incorporation rate for 2’-dNTPs in the presence of α-amanitin measured for WT and H1085Y Pol II. Elongation complexes formed exactly as in Figure 2B, but treated with various concentrations of 2’-dATP or 2’-dGTP as specified by appropriate DNA template in the presence of 40 µg/mL α-amanitin (Supplemental Figure 1B). Maximum average incorporation rates for 2’-dATP or 2’-dGTP for WT Pol II and H1085Y are shown with error bars representing the 95% confidence interval of the mean. Untreated values are from Figure 2B and shown for comparison. C. α-amanitin inhibition of GTP misincorporation by WT and H1085Y Pol II elongation complexes. Experiment is the same as Figure 2C, save for the addition of 40 µg/mL α-amanitin in treated samples (Supplemental Figure 1C). Untreated values are from Figure 2C and the graph represents mean misincorporation rate with error bars representing the standard deviation of the mean. D. α-amanitin inhibits addition of a single NTP by WT Pol II while H1085Y is mostly resistant. WT and H1085Y Pol II enzymes were prepared as in Figure 2B and aliquots were incubated with a titration of either ATP or GTP as specified by the DNA template, for 5 minutes. The values shown are the mean fold inhibition by 40 µg/mL α-amanitin from several experiments, as determined by concentration of substrate that gives half-maximal incorporation in the presence of 40 µg/mL α-amanitin divided by the concentration that gives half-maximal incorporation with no α-amanitin. Error bars represent +/− SD.
Figure 4
Figure 4. TL mutants exhibit complex phenotypes in vivo and have distinct effects on Pol II substrate selectivity and α-amanitin sensitivity in vitro
A. Schematic illustrating TL mutants isolated previously (Archambault et al., 1998; Hekmatpanah and Young, 1991; Malagon et al., 2006)(yellow filled circles) and those newly described in this work from genetic screens and site-directed mutagenesis (red or black filled circles). Numbers indicated amino acid position in S. cerevisiae Rpb1. Letters in unfilled circles indicate WT residues at those positions. Letters in filled circles indicated residue substitutions conferring mutant phenotypes in vivo. Black filled circles represent site-directed substitutions that are lethal. B. Phenotypes of selected TL mutants. TL mutants were transformed into a parent strain containing lys2-128∂, a marker allele for the Sptphenotype (Simchen et al., 1984). 10-fold serial dilutions of TL mutant saturated liquid cultures were spotted onto several different media to illustrate growth differences of TL mutants compared to a WT strain. YP Dextrose plates illustrate growth differences on rich media with 2% Dextrose as carbon source. SC-Leu plates are minimal media lacking the amino acid leucine and illustrate differences in growth on minimal media and act as an untreated control for growth on SC-Leu in the presence of 20 µg/mL MPA. SC-Lys plates are minimal media lacking lysine, and assay the Spt- phenotype. A WT Pol II strain cannot grow on SC-Lys due to the lys2-128∂ allele, however mutants conferring the Spt− phenotype suppress this allele and allow growth. C. Altered elongation rate and sensitivity of NTP substrate usage to α-amanitin of selected TL mutants. Maximum elongation rates were measured as in Figure 2A and Figure 3A, with WT and H1085Y Pol II values shown for comparison. D. Altered 2’-dGTP substrate usage and α-amanitin sensitivity of selected TL mutants. Incorporation rates determined as in Figures 2B and 3B, with WT and H1085Y Pol II values shown for comparison. E. Altered GTP misincorporation and sensitivity to α-amanitin of selected TL mutants. Misincorporation rates determined as in Figure 2C and Figure 3C, with WT and H1085Y Pol II values shown for comparison.
Figure 5
Figure 5. Resistance of H1085Y Pol II to α-amanitin and conservation of α-amanitin substrate-selective inhibition
A. Elongation rates at 500 µM NTPs for WT Pol II and TL mutant enzymes in the presence of increasing amounts of α-amanitin determined as in Figure 2A. Top panel plots elongation rates determined from production of run off product (61 nt) as in Figure 2A. F1086S Pol II was too slow in the presence of higher concentrations of α-amanitin to accurately quantify accumulation of 61 nt run off product, therefore elongation rates in the presence of α-amanitin were determined from accumulation of 23 nt and higher products for F1086S and WT Pol II for comparison (bottom panel). Note log scale on y-axes. B. α-amanitin inhibition of 2’-dATP usage by wild type Pol II is different than inhibition of NTP usage, while α-amanitin has no effect on H1085Y. Incorporation rate at 2 mM 2’-dATP in the presence of increasing amounts of α-amanitin determined as in Figure 2B. Values from three experiments are plotted. C. α-amanitin strongly inhibits elongation by Calf Thymus Pol II. Elongation assay and rate calculation in the absence and presence of 10 µg/mL α-amanitin exactly as in Figure 2A. For untreated samples, elongation over 48 nt was used to determine average elongation rate. For treated samples, elongation over 3 nt was used to determine average elongation rate. Inferred maximum elongation rates are shown with error bars representing the 95% confidence interval. D. α-amanitin weakly inhibits 2’- dNTP usage by Calf Thymus Pol II. Assay performed and rates determined exactly as in Figure 2B with α-amanitin treatment as in Figure 3B, except α-amanitin was at 10 µg/mL. For 2’-dGTP experiments, inferred maximal incorporation rate is shown with error bars representing the 95% confidence interval. For 2’-dATP experiments, incorporation rate for 2 mM 2’-dATP is shown as the mean of several experiments +/− standard deviation of the mean. E. α-amanitin inhibits single nucleotide addition by Calf Thymus Pol II. Experiment performed exactly as in Figure 3D. Values shown are the concentration of substrate that gives half-maximal incorporation over a 5-minute incubation. Lower values represent lower concentration of substrate required for a specified elongation rate, and thus a faster elongating enzyme. Values are the mean of at least three experiments +/− standard deviation of the mean. Note that y-axes are logarithmic scale.
Figure 6
Figure 6. Resistance of H1085Y Pol II to α-amanitin inhibition of TFIIS-mediated RNA cleavage
A. Purified WT and H1085Y stalled elongation complexes were treated with different amounts of TFIIS in the absence or presence of 40 µg/mL α-amanitin over a 20 minute time course followed by separation of RNA products by denaturing polyacrylamide gel electrophoresis. TFIIS-mediated RNA cleavage results in a shortening of transcript from the 3’-end, resulting in faster migrating RNA products. B. WT and H1085Y Pol II “backtracked” complexes were formed by incubation of polymerases with a nucleic acid scaffold containing a 13-mer RNA with two mismatches to the template at the 3’-end. These complexes were treated with TFIIS over a 20-minute time course in the absence or presence of 40 µg/mL α-amanitin. TFIIS-mediated RNA cleavage results in a shortening of transcript from the 3’-end.
Figure 7
Figure 7. Direct Interaction Between Rpb1 His1085 and α-amanitin and TL Capture May Underlie α-amanitin Inhibition of Transcription
A. Overall view of .-amanitin and the new TL conformation and position in relation to the Bridge helix (BH). A superpositioned EC structure (PDB 2E2H) showing DNA (magenta), RNA (red), non-template DNA (green) and nucleotide GTP (orange) highlights the position of the inhibitor and TL in relation to EC components. B. A 90° rotation shows the α-amanitin position in relation to the Bridge helix (BH) and its capture of the TL Rpb1 His1085. C. TL residues Rpb1 1084–1086 and the entire α-amanitin modeled into electron density (dark grey mesh) from an initial unbiased 2Fo-Fc electron density map contoured at 0.6 σ

References

    1. Adams PD, Grosse-Kunstleve RW, Hung LW, Ioerger TR, McCoy AJ, Moriarty NW, Read RJ, Sacchettini JC, Sauter NK, Terwilliger TC. PHENIX: building new software for automated crystallographic structure determination. Acta Crystallogr D Biol Crystallogr. 2002;58:1948–1954. - PubMed
    1. Archambault J, Jansma DB, Kawasoe JH, Arndt KT, Greenblatt J, Friesen JD. Stimulation of transcription by mutations affecting conserved regions of RNA polymerase II. J Bacteriol. 1998;180:2590–2598. - PMC - PubMed
    1. Archambault J, Lacroute F, Ruet A, Friesen JD. Genetic interaction between transcription elongation factor TFIIS and RNA polymerase II. Mol Cell Biol. 1992;12:4142–4152. - PMC - PubMed
    1. Bar-Nahum G, Epshtein V, Ruckenstein AE, Rafikov R, Mustaev A, Nudler E. A ratchet mechanism of transcription elongation and its control. Cell. 2005;120:183–193. - PubMed
    1. Bushnell DA, Cramer P, Kornberg RD. Structural basis of transcription: alpha-amanitin-RNA polymerase II cocrystal at 2.8 A resolution. Proc Natl Acad Sci U S A. 2002;99:1218–1222. - PMC - PubMed

Publication types

MeSH terms

LinkOut - more resources