. 2008 Jun 6;30(5):578-88.
doi: 10.1016/j.molcel.2008.05.004.

Spontaneous intersubunit rotation in single ribosomes

Affiliations

Spontaneous intersubunit rotation in single ribosomes

Peter V Cornish et al. Mol Cell. .

Abstract

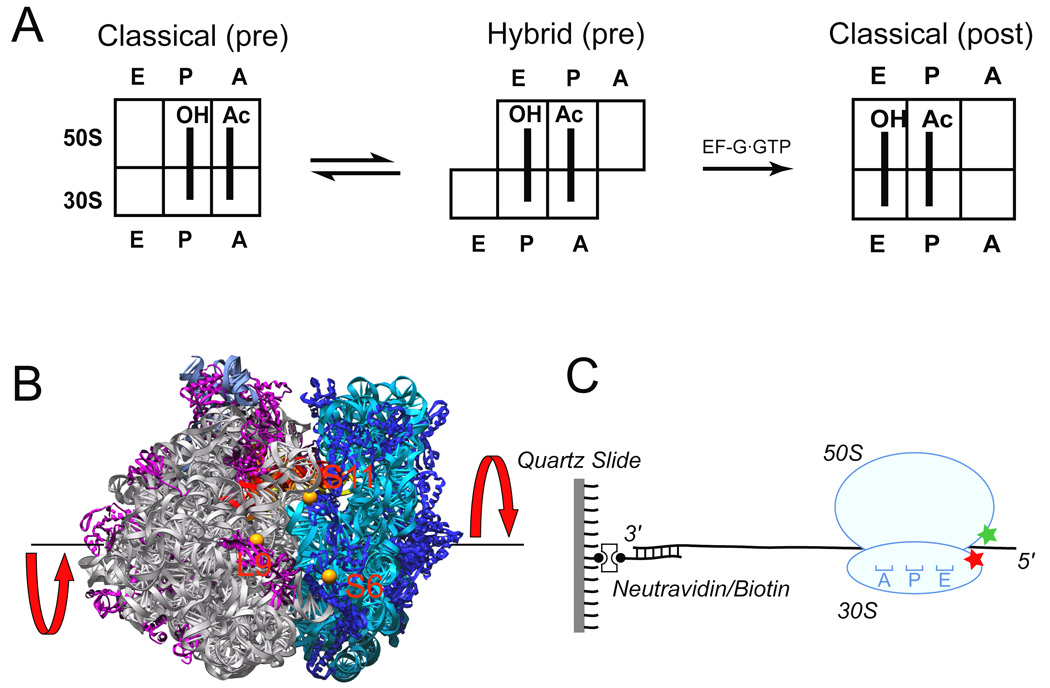
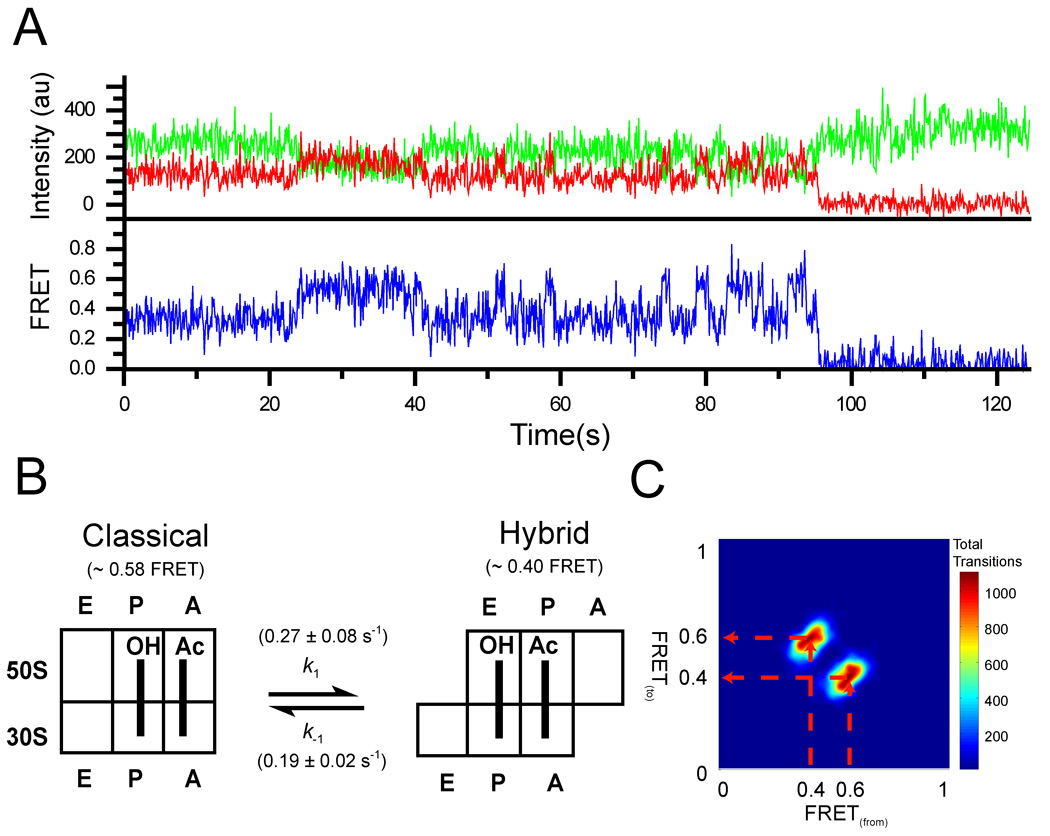
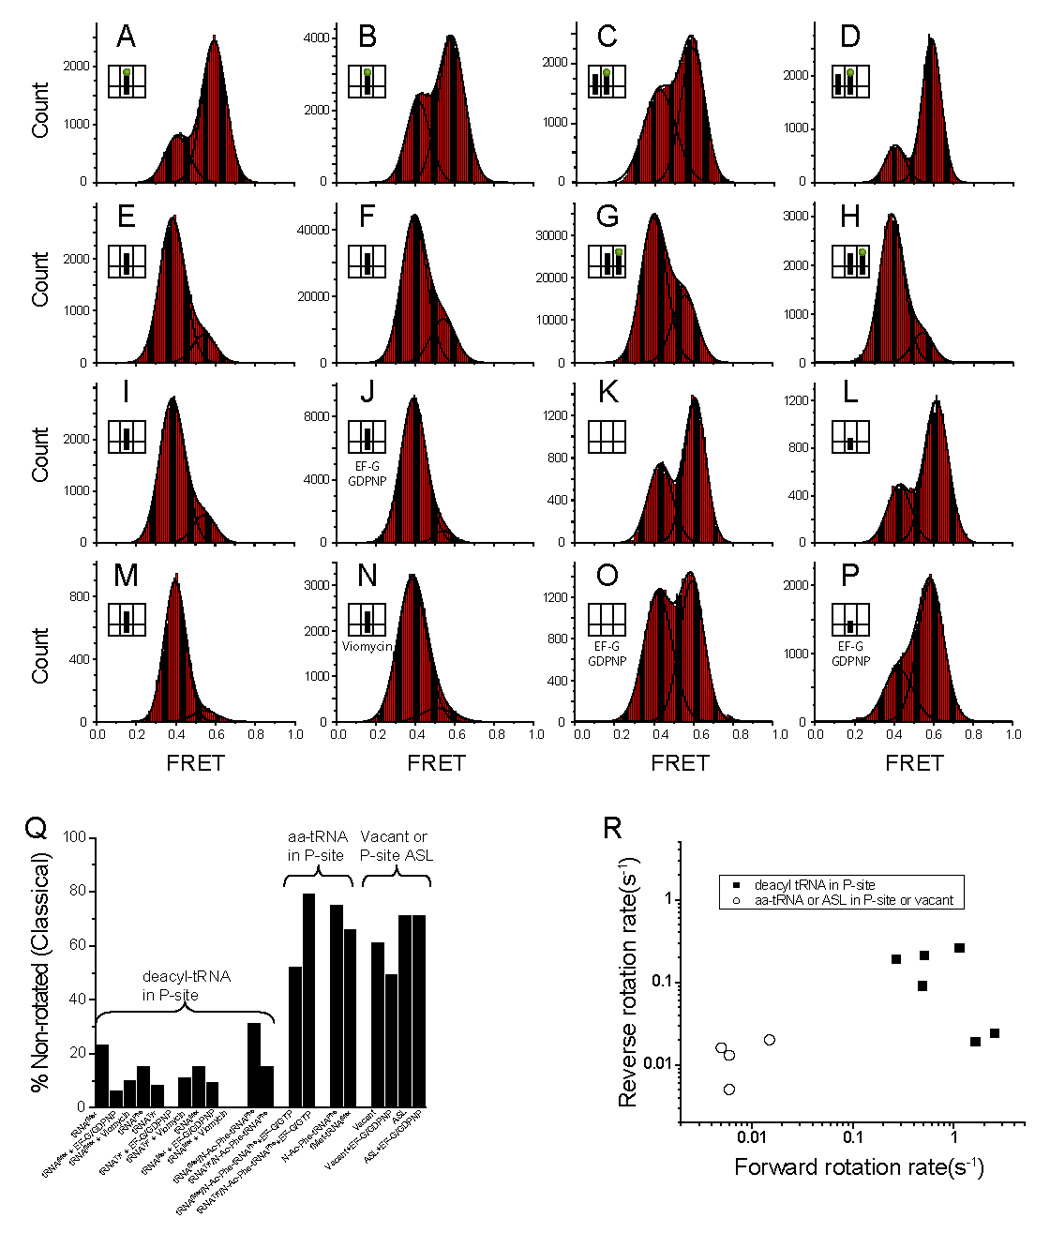
During the elongation cycle, tRNA and mRNA undergo coupled translocation through the ribosome catalyzed by elongation factor G (EF-G). Cryo-EM reconstructions of certain EF-G-containing complexes led to the proposal that the mechanism of translocation involves rotational movement between the two ribosomal subunits. Here, using single-molecule FRET, we observe that pretranslocation ribosomes undergo spontaneous intersubunit rotational movement in the absence of EF-G, fluctuating between two conformations corresponding to the classical and hybrid states of the translocational cycle. In contrast, posttranslocation ribosomes are fixed predominantly in the classical, nonrotated state. Movement of the acceptor stem of deacylated tRNA into the 50S E site and EF-G binding to the ribosome both contribute to stabilization of the rotated, hybrid state. Furthermore, the acylation state of P site tRNA has a dramatic effect on the frequency of intersubunit rotation. Our results provide direct evidence that the intersubunit rotation that underlies ribosomal translocation is thermally driven.


Figures

Figure 1
Figure 1. Experimental design
a. Cartoon showing the movement of deacylated tRNAfMet (initially in the P site) and peptidyl-tRNA analogue N-Ac-Phe-tRNAPhe (initially in A site) during translocation between classical pre-translocation, hybrid pre-translocation and classical post-translocation states. b. Positions of fluorescent dyes (orange spheres) coupled to proteins L9, S6 and S11 in the 70S ribosome, viewed from the E-site interface side of the crystal structure (Korostelev et al., 2006). The 50S subunit is on the left (23S and 5S rRNAs are in grey, proteins in magenta) and the 30S subunit is on the right (16S rRNA in cyan, proteins in blue). The E-site tRNA (red) can be seen spanning the interface. The red arrows indicate the direction of intersubunit rotation accompanying hybrid state formation. c. Ribosomes were immobilized by hybridization of the 3’ tail of the mRNA to a biotin-derivatized DNA strand that was bound via neutravidin to a quartz cover slip.
Figure 2
Figure 2. HMM analysis of FRET data obtained from S6-Cy5/L9-Cy3 pre-translocation ribosomes
a. Representative trace showing fluorescence intensities observed for the Cy3 donor (green) attached to L9 and a Cy5 acceptor attached to S6 (red) in ribosomes containing tRNAfMet in the P site and N-Ac-Phe-tRNAPhe in the A site. b. Schematic showing the observed FRET values for the two states and the forward and reverse transition frequencies (k1 and k−1). c. Transition density plot (TDP) for the pre-translocation complex. The TDP is constructed by plotting values for each transition based upon the FRET value from which the transition originated (x-axis) and to which FRET value the transition ends (y-axis). The transition paths are indicated by the broken red arrows.
Figure 3
Figure 3. Representative time traces from HMM analysis of S6-Cy5/L9-Cy3 ribosomes containing deacylated tRNAfMet in the P site and N-Ac-Phe-tRNAPhe in the A site
Cy3 and Cy5 intensities are shown as green and red traces, respectively. The calculated FRET curve is shown in blue with the HMM-determined fit overlaid in black.
Figure 4
Figure 4. Histograms compiled from several hundred time traces showing distributions of FRET values for different ribosome complexes
S6-Cy5/L9-Cy3 ribosomes were assembled with mRNA and (a) N-Ac-Phe-tRNAPhe in the P-site, (b) fMet-tRNAfMet in the P-site, (c) tRNAfMet in the P-site and N-Ac-Phe-tRNAPhe in the A-site translocated with EF-G·GTP, (d) tRNATyr in the P-site and N-Ac-Phe-tRNAPhe in the A-site translocated with EF-G·GTP, (e) tRNAPhe in the P-site due to deacylation of the complex in panel (a) with puromycin, (f) tRNAfMet in the P-site, (g) tRNAfMet in the P-site and N-Ac-Phe-tRNAPhe in the A-site, (h) tRNATyr in the P-site and N-Ac-Phe-tRNAPhe in the A-site, (i) tRNAMet in the P-site (j) tRNAfMet with EF-G·GDPNP, (k) no tRNA, (l) Anticodon Stem Loop (ASL) from tRNAfMet, (m) tRNATyr in the P-site, (n) tRNAfMet with viomycin, (o) no tRNA with EF-G·GDPNP, and (p) Anticodon Stem Loop (ASL) from tRNAfMet with EF-G·GDPNP. The FRET data was smoothed with a 5 point window and can be fitted to two Gaussians. (q) A graphical depiction of the percent of each complex in the non-rotated state (Table 2). It is clear that the non-rotated state is weakly populated if the P-site tRNA is deacylated in comparison to other constructs. (r) A scatter plot showing the forward vs. reverse rotation rates for various ribosomal complexes (Table 2). The ribosomes with a deacylated tRNA have much higher rates of forward and reverse rotation. The data with EF-G are not included in the plot.
Figure 5
Figure 5. Single-molecule time traces of S6-Cy5/L9-Cy3 ribosome complexes showing intersubunit movement induced by (a) reaction with puromycin, (b) EF-G binding or (c) translocation
(a) Ribosomes containing fMet-tRNAfMet bound to the P site were reacted with puromycin (1 mM) in buffer B (see Experimental procedures), flowed into the microscope slide ~20 s after beginning the fluorescence recording (arrow). Intersubunit movement is seen as a sharp decrease in the FRET signal (indicated by the vertical dashed line). 13 of 24 molecules that did not photobleach before addition of puromycin showed similar behavior with an average deacylation time of ~20s. (b) EFG-GDPNP (300 nM, 250 µM) in buffer B (see Experimental procedures) was introduced at ~40s (arrow) into complexes containing deacylated tRNAfMet bound to the P site and a vacant A site. EF-G-induced intersubunit rotation is observed as stabilization of the low FRET state (vertical dashed line). 42 of 51 molecules showed similar behavior with an average time between addition of EFG·GDPNP and the last FRET fluctuation of ~15s (c) EF-G·GTP (300 nM, 250 µM) in buffer B (see Experimental procedures) was introduced at ~20 s (arrow) to pre-translocation complexes containing deacylated tRNAfMet bound to the P site and N-Ac-Phe-tRNAPhe bound to the A site. Translocation is observed as the transition to the high FRET state (vertical dashed line). 40 of 76 molecules showed similar behavior with an average translocation time of ~22s after addition of EF-G·GTP. For further information regarding the flow experiments, see Experimental Procedures.

References

    1. Amand B, Pochon F, Lavalette D. Rotational diffusion of Escherichia coli ribosomes. I. - Free 70 S, 50 S and 30 S particles. Biochimie. 1977;59:779–784. - PubMed
    1. Astumian RD. Thermodynamics and kinetics of a Brownian motor. Science. 1997;276:917–922. - PubMed
    1. Blanchard SC, Gonzalez RL, Kim HD, Chu S, Puglisi JD. tRNA selection and kinetic proofreading in translation. Nat Struct Mol Biol. 2004a;11:1008–1014. - PubMed
    1. Blanchard SC, Kim HD, Gonzalez RL, Jr, Puglisi JD, Chu S. tRNA dynamics on the ribosome during translation. Proceedings of the National Academy of Sciences of the United States of America. 2004b;101:12893–12898. - PMC - PubMed
    1. Cordova NJ, Ermentrout B, Oster GF. Dynamics of single-motor molecules: the thermal ratchet model. Proceedings of the National Academy of Sciences of the United States of America. 1992;89:339–343. - PMC - PubMed

Publication types

MeSH terms

LinkOut - more resources