. 2008 Jun 6;30(5):649-56.
doi: 10.1016/j.molcel.2008.04.016.

Regulation of cell signaling dynamics by the protein kinase-scaffold Ste5

Affiliations

Regulation of cell signaling dynamics by the protein kinase-scaffold Ste5

Nan Hao et al. Mol Cell. .

Abstract

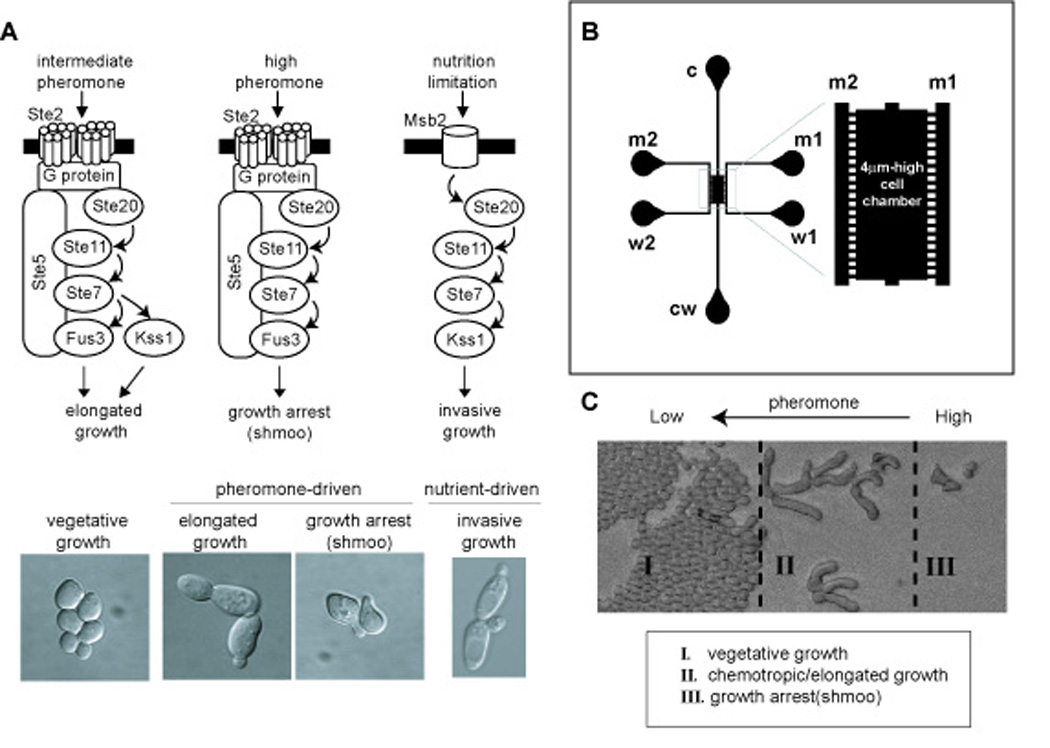
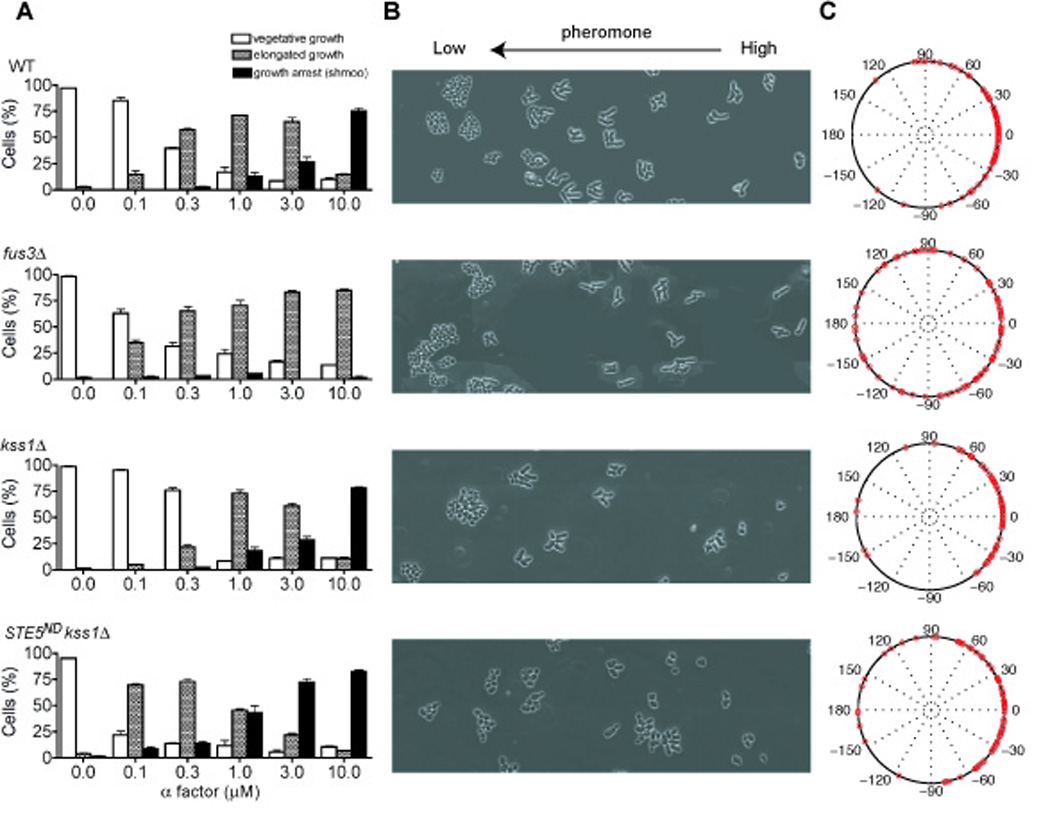
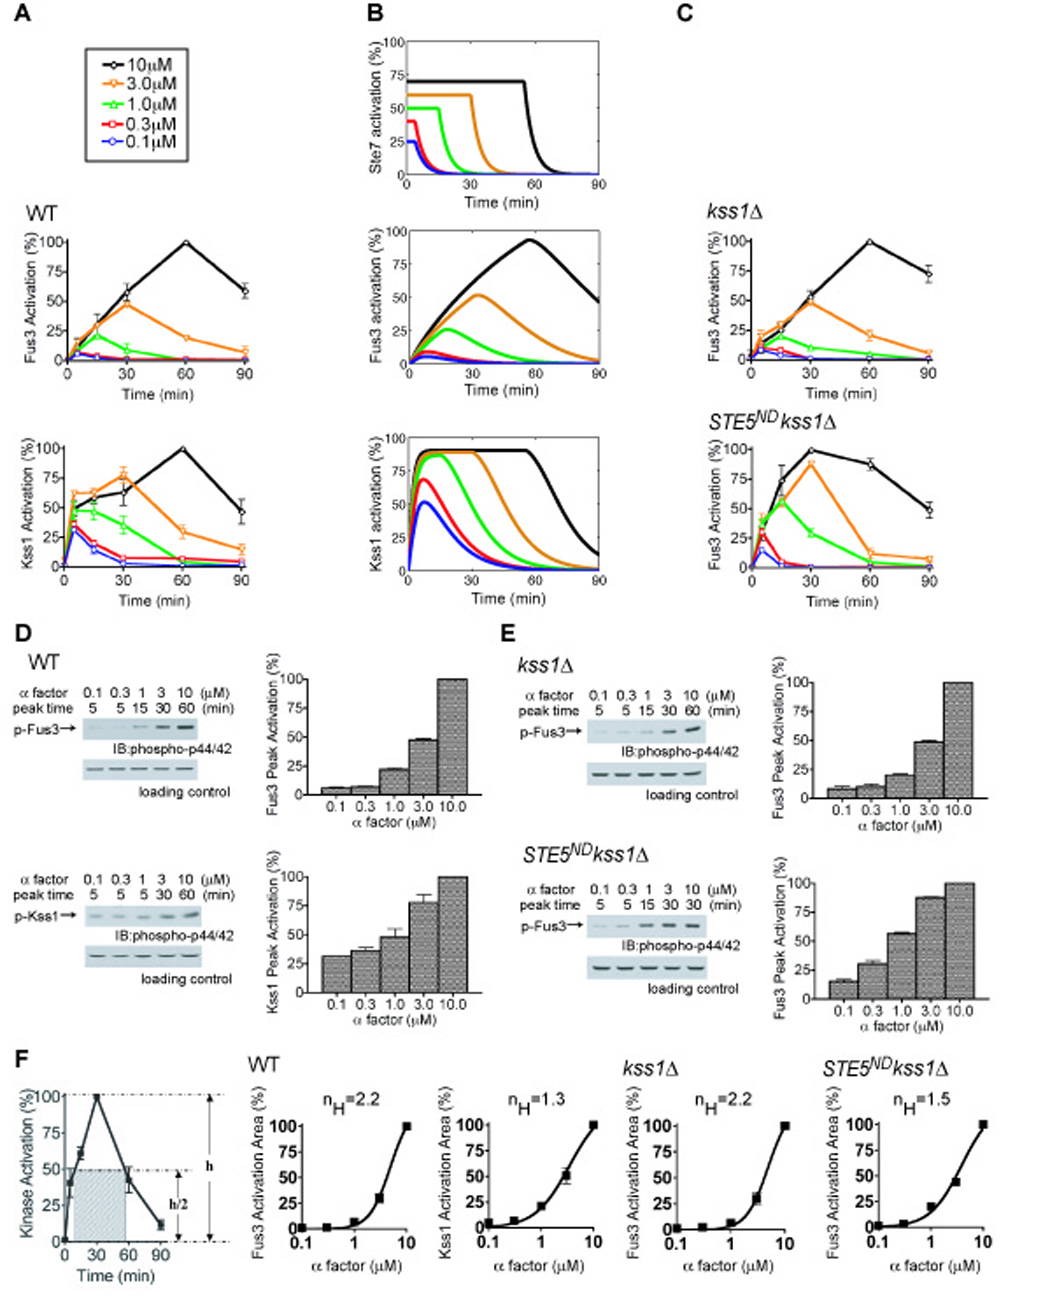
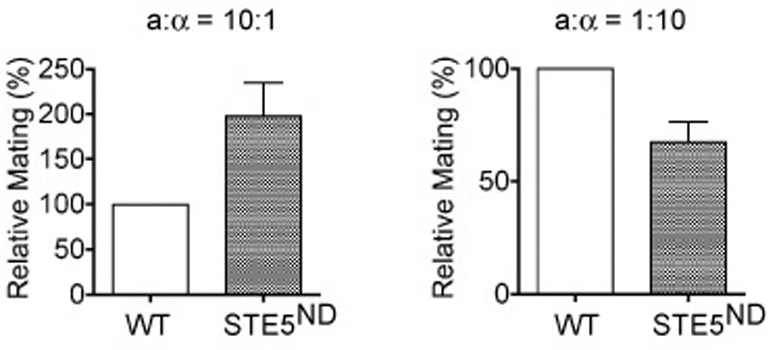
Cell differentiation requires the ability to detect and respond appropriately to a variety of extracellular signals. Here we investigate a differentiation switch induced by changes in the concentration of a single stimulus. Yeast cells exposed to high doses of mating pheromone undergo cell division arrest. Cells at intermediate doses become elongated and divide in the direction of a pheromone gradient (chemotropic growth). Either of the pheromone-responsive MAP kinases, Fus3 and Kss1, promotes cell elongation, but only Fus3 promotes chemotropic growth. Whereas Kss1 is activated rapidly and with a graded dose-response profile, Fus3 is activated slowly and exhibits a steeper dose-response relationship (ultrasensitivity). Fus3 activity requires the scaffold protein Ste5; when binding to Ste5 is abrogated, Fus3 behaves like Kss1, and the cells no longer respond to a gradient or mate efficiently with distant partners. We propose that scaffold proteins serve to modulate the temporal and dose-response behavior of the MAP kinase.


Figures

Fig. 1
Fig. 1. Yeast cell differentiation induced by different concentrations of pheromone
(A) Common signaling components are used for nutrient-driven invasive growth, as well as for the pheromone-driven switch from vegetative-growth to elongated-or chemotropic-growth and growth-arrest. (B) Schematic of the microfluidic gradient device. Ports c and cw correspond to cell loading and cell waste, respectively. Ports m1 and m2 are for media supply, w1 and w2 are media waste ports. Gradient within the chamber is established by diffusion between m1 and m2 via the microchannels that connect the media channels to the cell chamber. (C) Yeast cells undergo three distinct developmental fates in a pheromone gradient. Cells are loaded evenly and at a very low density, but rapidly dividing cells eventually fill the chamber at the lowest concentrations of pheromone (zone I).
Fig. 2
Fig. 2. Experimental measurements of yeast cell differentiation
(A) Cell morphologies classified as: vegetative-growth, elongated-growth (length:width ≥1.6), or shmoo. Wild-type and mutant cells exposed to a uniform concentration of pheromone exhibit each of the three morphologies. (B) Cells exposed to a linear gradient of pheromone exhibit the three morphologies depending on their position within the chamber. Cell differentiation was recorded at 600 min for 3 independent experiments. (C) Chemotropic-growth quantified as the angle of cell projections and the direction of the gradient, represented with polar plots. Error bars, +/− standard error of the mean.
Fig. 3
Fig. 3. Experimental and computational analysis of MAP kinase activation with or without Ste5
Time course of MAP kinase activation monitored in wild-type (A, D) and mutant (C, E) strains treated with the indicated pheromone concentrations, using phospho-p42/44 antibodies that recognize the dually-phosphorylated (fully activated) form of each protein. (B) Simple mathematical models qualitatively reproduce the experimental data for Fus3 and Kss1 activation. Each model assumes that the upstream signal (e.g. Ste7) is saturated at early times and at low pheromone concentrations, and any further increases in pheromone concentration prolong the duration of the upstream signal. (D, E) Kinase activation quantified as the percentage of maximum activation obtained at each dose (Peak Activation). (F) Kinase activation at different concentrations of pheromone quantified as the area of the rectangle fit to half-maximum activity (Activation Area) and fit by the Hill equation (nH, Hill coefficient). Band intensity from 3 or more experiments was quantified by scanning densitometry presented as percentage of maximum intensity for each experiment. Error bars, +/− standard error of the mean.
Fig. 4
Fig. 4. Physiological analysis of the role of Ste5 in mating
Wild-type or STE5ND a-type cells and α-type tester cells were spread separately and evenly onto plates containing selective medium. Colonies of a/□diploids were counted after 2 days. Mating efficiencies averaged from 3 independent experiments are relative to wild-type (WT). Error bars, +/− standard error of the mean.

References

    1. Andersson J, Simpson DM, Qi M, Wang Y, Elion EA. Differential input by Ste5 scaffold and Msg5 phosphatase route a MAPK cascade to multiple outcomes. Embo J. 2004;23:2564–2576. - PMC - PubMed
    1. Bhattacharyya RP, Remenyi A, Good MC, Bashor CJ, Falick AM, Lim WA. The Ste5 scaffold allosterically modulates signaling output of the yeast mating pathway. Science. 2006;311:822–826. - PubMed
    1. Breitkreutz A, Boucher L, Tyers M. MAPK specificity in the yeast pheromone response independent of transcriptional activation. Curr Biol. 2001;11:1266–1271. - PubMed
    1. Choi KY, Satterberg B, Lyons DM, Elion EA. Ste5 tethers multiple protein kinases in the MAP kinase cascade required for mating in S. cerevisiae. Cell. 1994;78:499–512. - PubMed
    1. Cook JG, Bardwell L, Thorner J. Inhibitory and activating functions for MAPK Kss1 in the S. cerevisiae filamentous-growth signalling pathway. Nature. 1997;390:85–88. - PubMed

MeSH terms

Substances