. 2008 Jun;13(6):483-95.
doi: 10.1016/j.ccr.2008.04.020.

Microenvironment determines lineage fate in a human model of MLL-AF9 leukemia

Affiliations

Microenvironment determines lineage fate in a human model of MLL-AF9 leukemia

Junping Wei et al. Cancer Cell. 2008 Jun.

Abstract

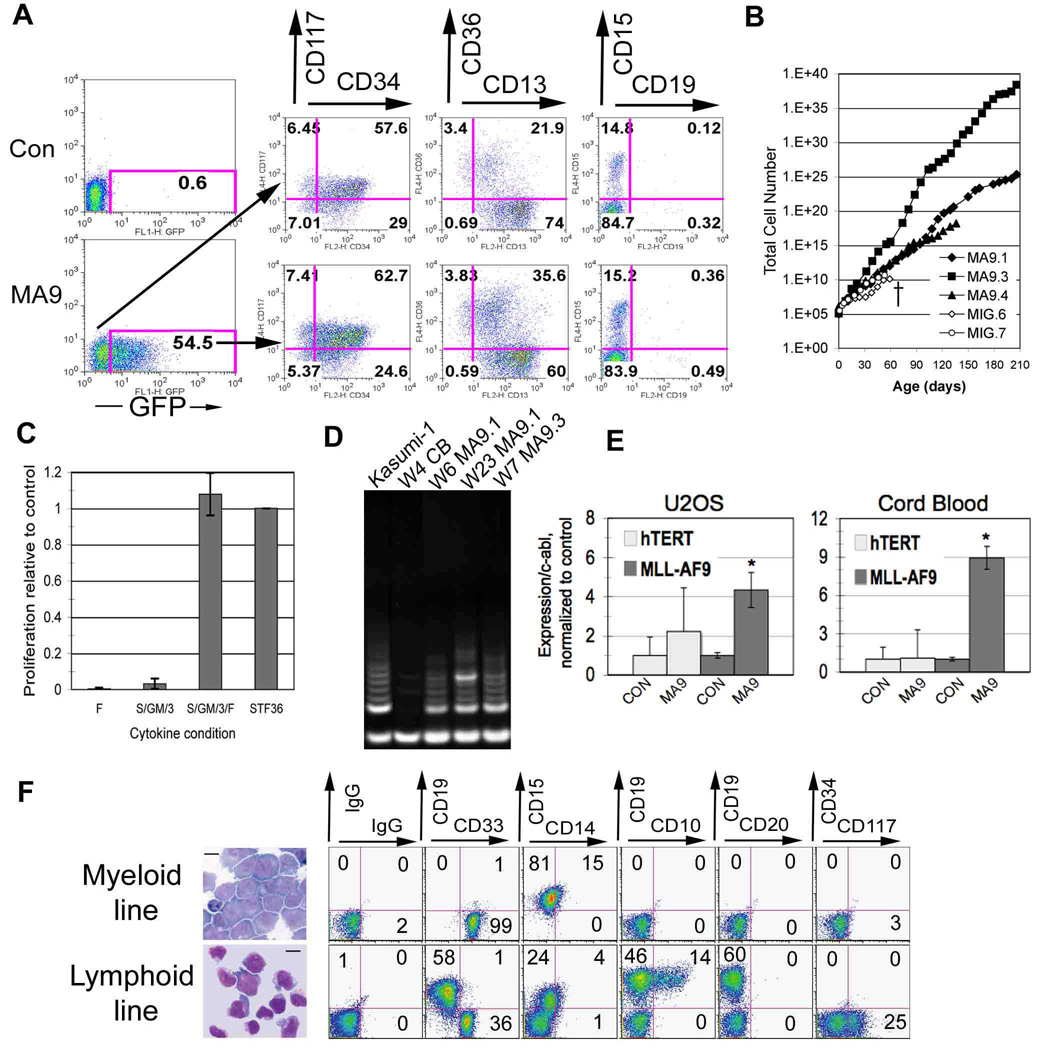
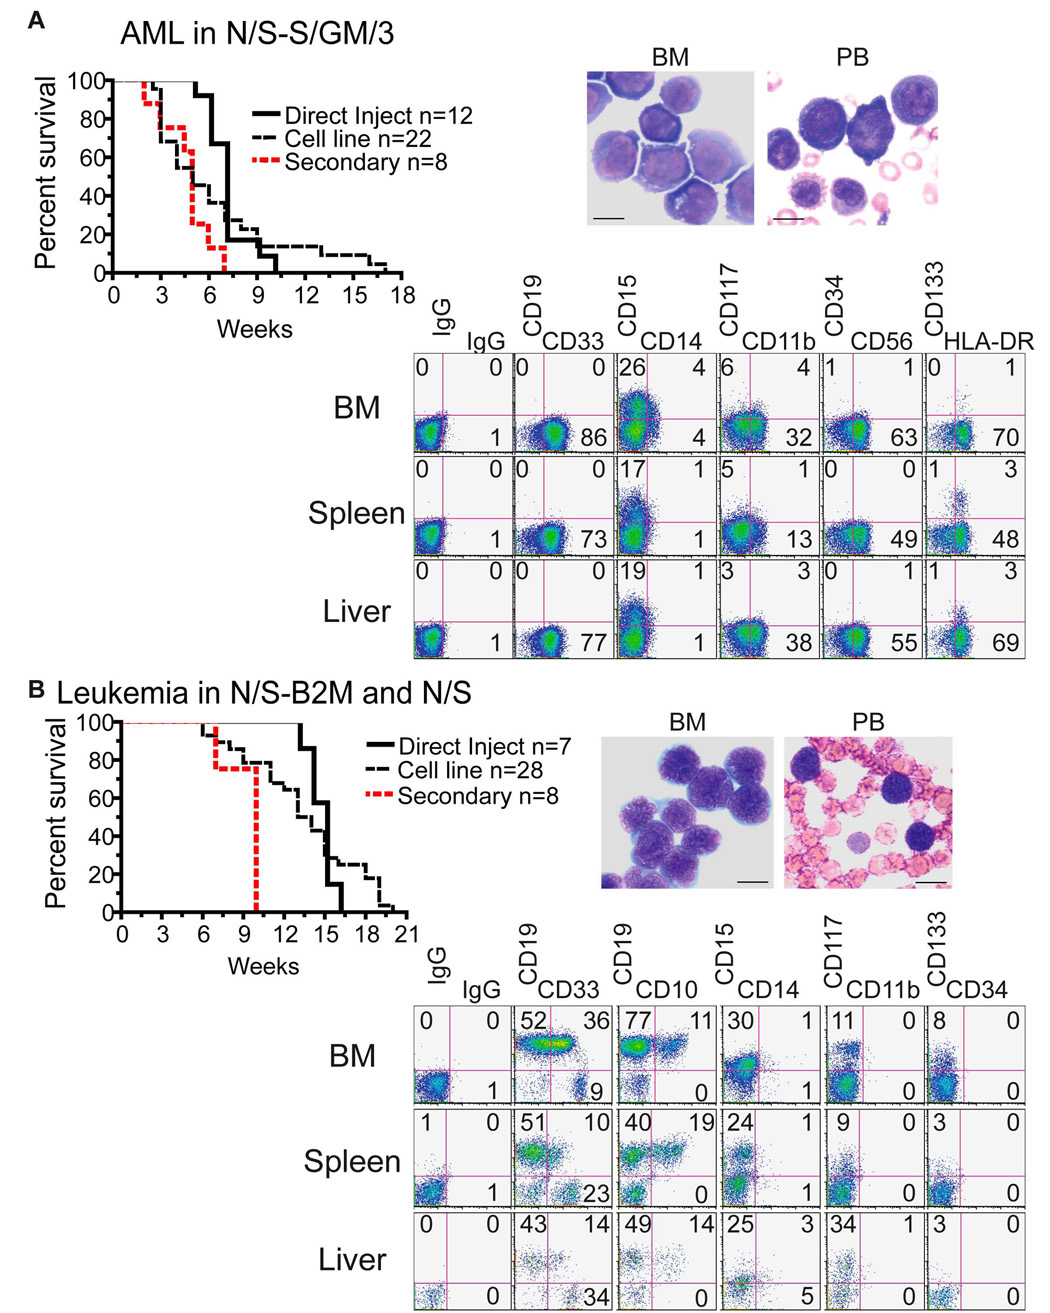
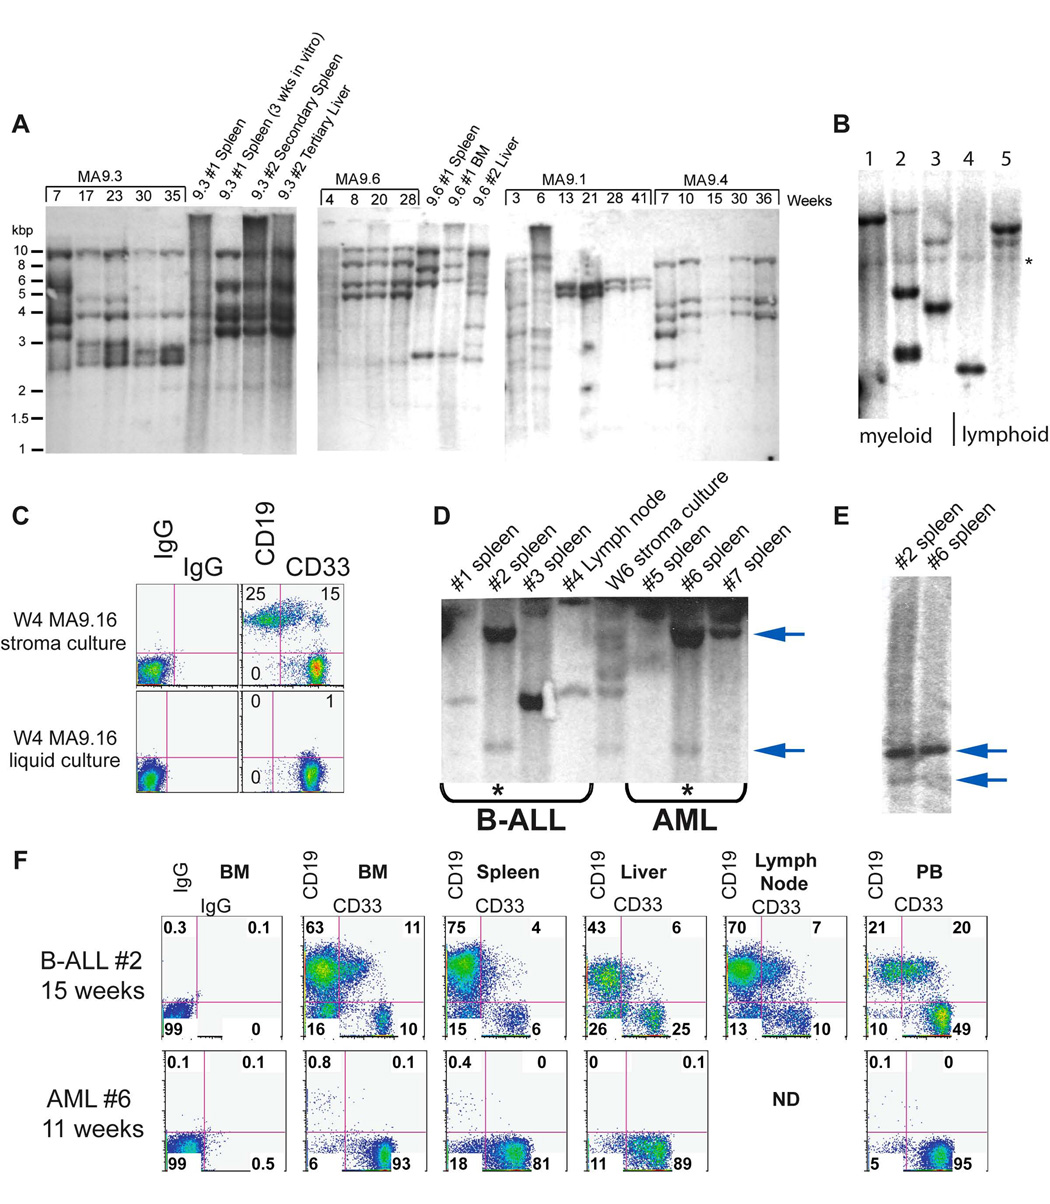
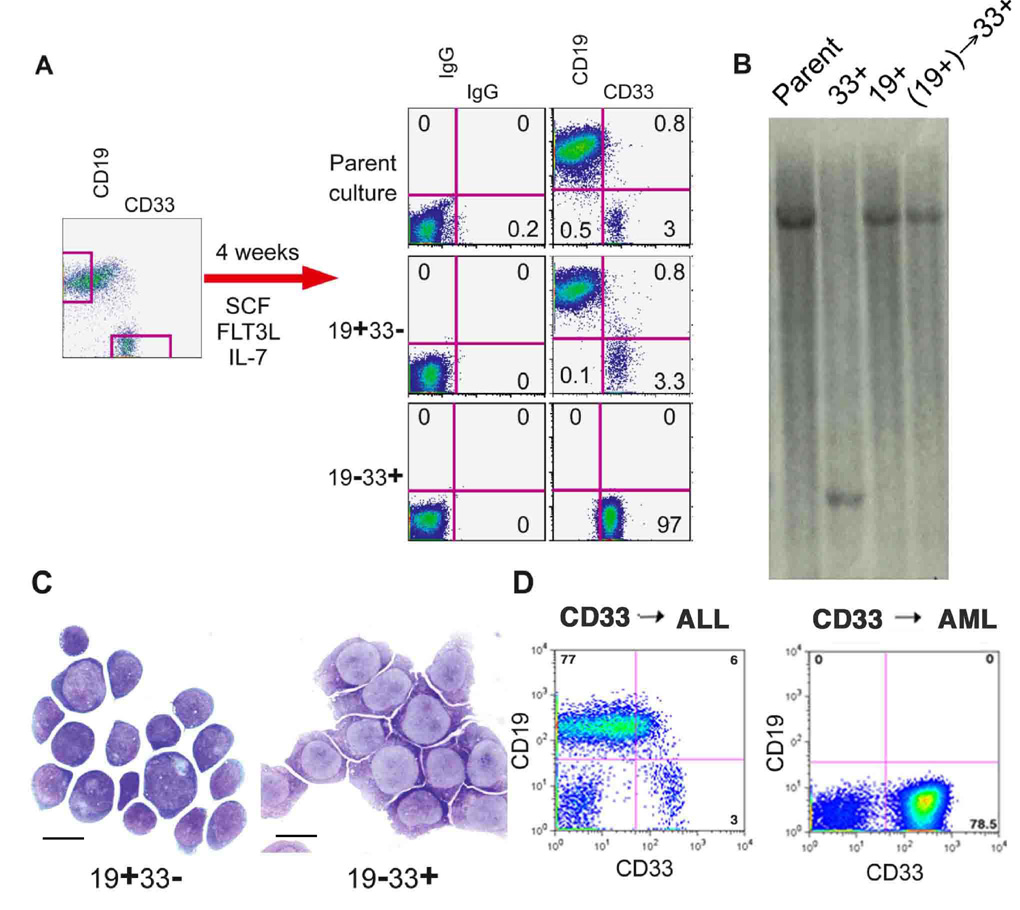
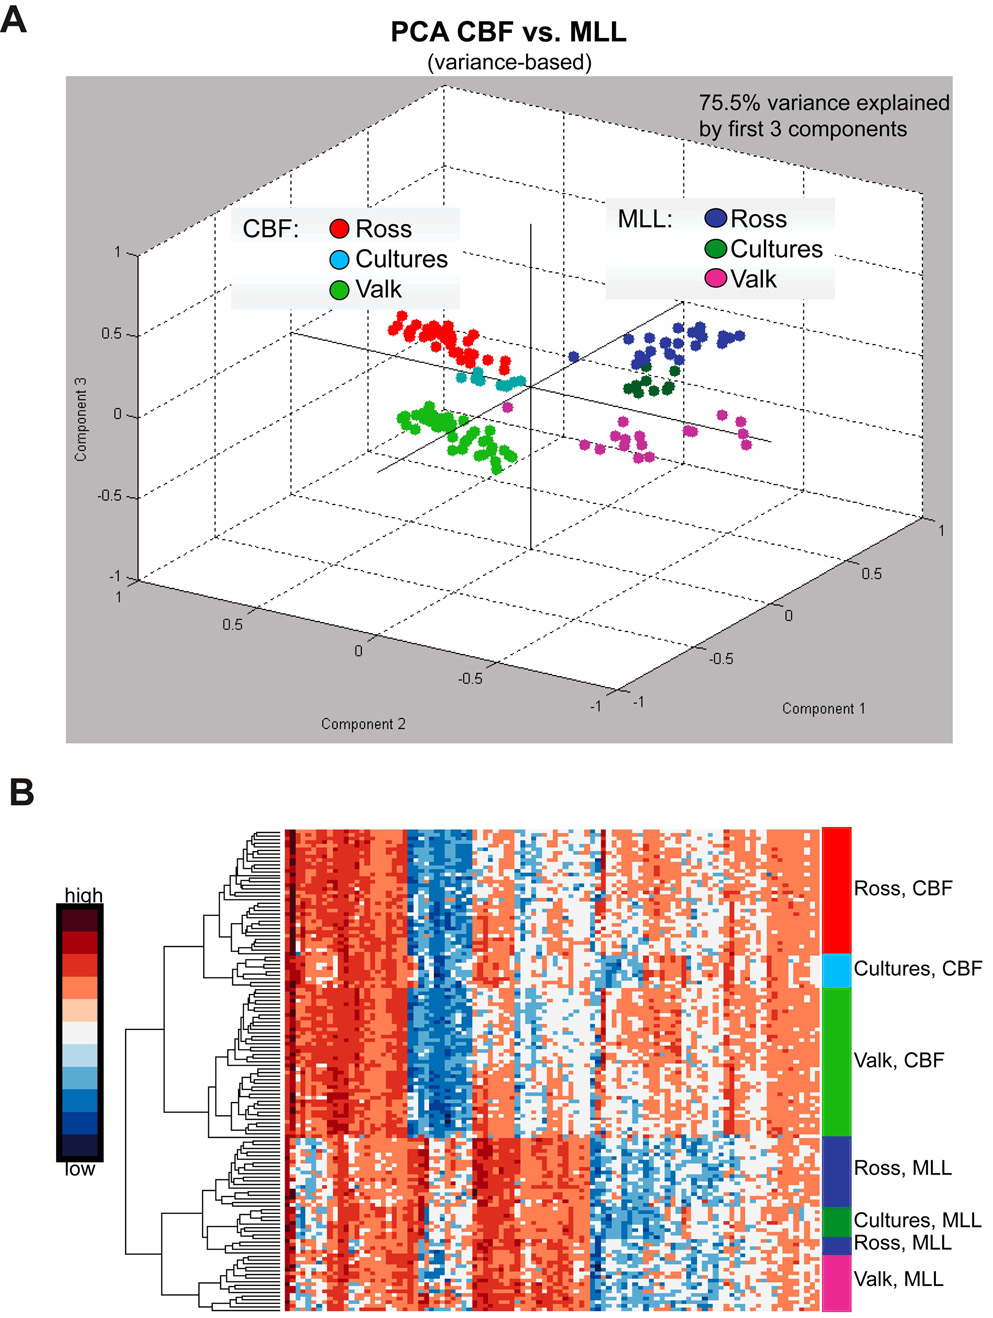
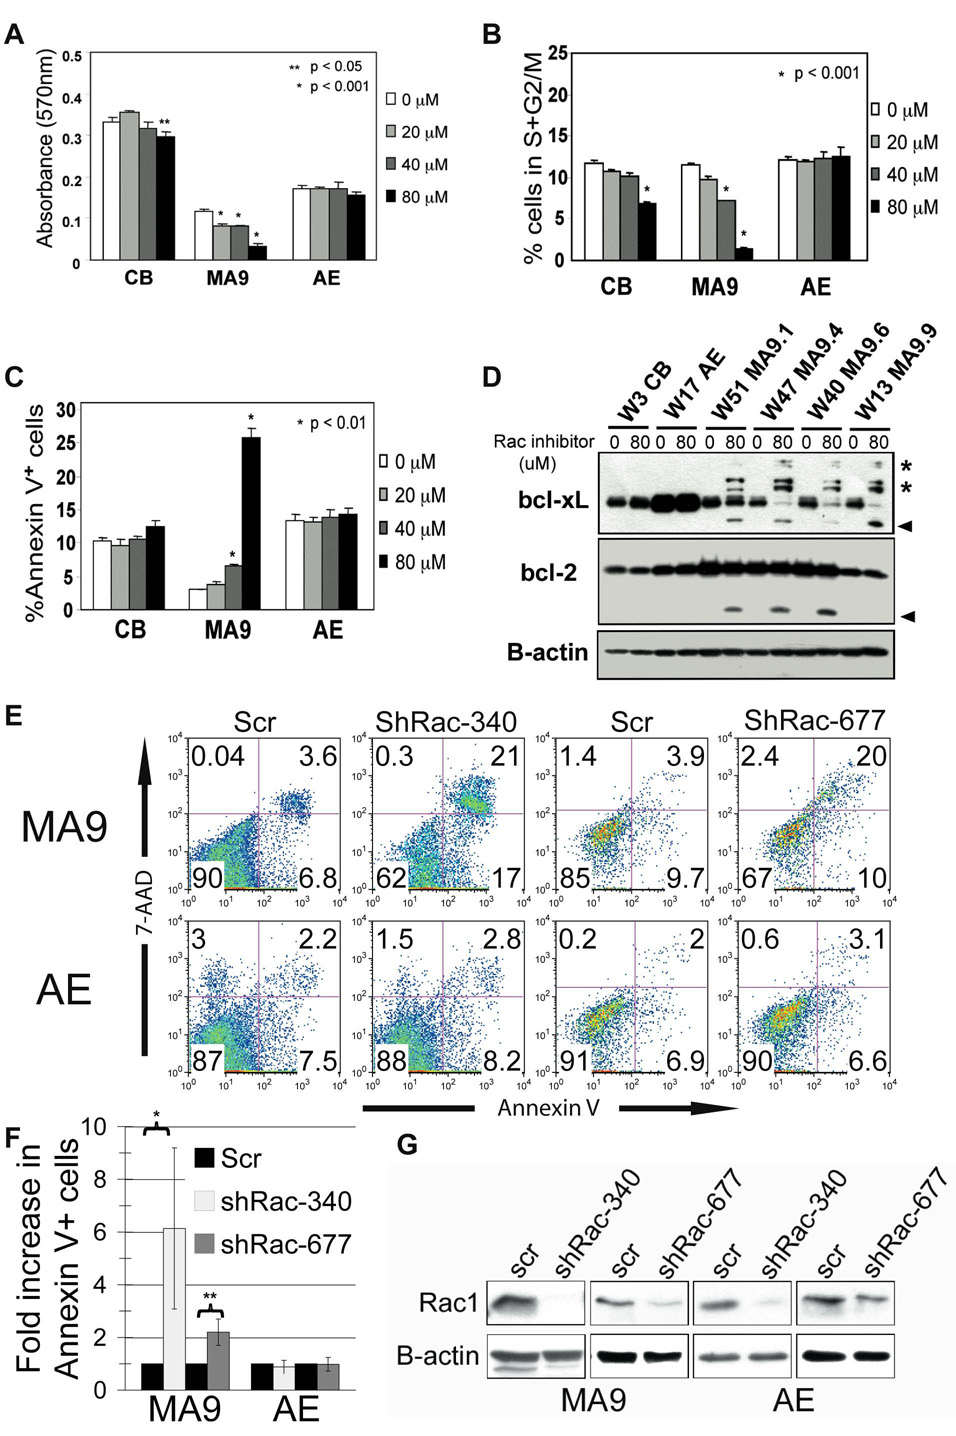
Faithful modeling of mixed-lineage leukemia in murine cells has been difficult to achieve. We show that expression of MLL-AF9 in human CD34+ cells induces acute myeloid, lymphoid, or mixed-lineage leukemia in immunodeficient mice. Some leukemia stem cells (LSC) were multipotent and could be lineage directed by altering either the growth factors or the recipient strain of mouse, highlighting the importance of microenvironmental cues. Other LSC were strictly lineage committed, demonstrating the heterogeneity of the stem cell compartment in MLL disease. Targeting the Rac signaling pathway by pharmacologic or genetic means resulted in rapid and specific apoptosis of MLL-AF9 cells, suggesting that the Rac signaling pathway may be a valid therapeutic target in MLL-rearranged AML.


Figures

Figure 1
Figure 1. MLL-AF9 expression supports long-term proliferation and maturation arrest of CD34+ cord blood cells
A) Immunophenotype of MLL-AF9 positive and negative cells on day 2 after transduction. B) MLL-AF9 expression results in immortalization of primary CB cells. A growth curve charts the differences in proliferative capacity between control (MIG) and MLL-AF9 positive (MA9) cells. C) MA9 expressing cells are particularly sensitive to FLT3L for proliferation. Cells cultured in the presence of FLT3L alone, SGM3, SGM3/F and (+) (S/T/F/3/6) respectively, were counted by trypan blue dye exclusion after one week. Results are expressed as mean ± standard deviation (SD). D) Telomerase activity was analyzed in MA9 cells grown for varying periods of time in vitro. Cord blood cells and the leukemia cell line Kasumi-1 were used as controls. W=weeks. E) hTERT and MLL-AF9 transcript levels were analyzed by Q-PCR using Sybr Green and the standard curve method, with two different primer sets for hTERT. The U2OS cells were analyzed four days after transduction and puromycin selection and the cord blood samples were tested at day 7 when the majority of cells in control and MA9 cultures were GFP+. Two independent cord blood samples were used and showed identical results. Results are shown as mean + SD with asterisks indicating significance of p≤ 0.05. hTERT transcript levels were essentially negative in U2OS, with signals detected at amplification cycles similar to no template control. F) Cytospins and flow cytometric analysis of long-term cultured cells grown under myeloid and lymphoid conditions. Scale bars represent 10 µm.
Figure 2
Figure 2. MLL-AF9 expressing cells produce leukemia in immunodeficient mice
MA9 myeloid or lymphoid cultures (cell line), and freshly transduced CB cells (direct inject), were injected into NS-SGM3 mice (panel A) and NS or NS-B2M mice (panel B). Mice were sacrificed upon signs of illness. A Kaplan-Meier survival plot is shown for each cohort of animals. Wright-Giemsa stained BM cytospins and peripheral blood smears indicate that the circulatory system is full of immature myeloid or lymphoid blast cells. Scale bars represent 10 µm. Cells from mouse bone marrow, spleen and liver were stained for human lineage differentiation markers. Representative samples from an AML and B-ALL/ABL mouse are shown.
Figure 3
Figure 3. Haematoxylin and eosin stained paraffin sections demonstrate disruption of organ architecture due to tumor infiltration
Organs and representative mice from animals with A) human AML disease and B) human B-ALL disease. Arrows indicate spleen and liver, and arrowheads show the enlarged lymph nodes in the B-ALL mouse. The asterisk highlights a leg tumor that is forming in the AML animal, which occasionally occurred after intrafemoral injection. A representative leg tumor is shown in panel C. Scale bars represent 100 µm unless indicated otherwise.
Figure 4
Figure 4. Oligoclonal outgrowth is detected in vivo as well as in vitro
A) Samples were collected from culture and from affected mice at the indicated times and genomic DNA was digested with HinDIII or EcoR1 to detect clonal integration of provirus using a GFP probe. Polyclonal to oligoclonal patterns are present at early time-points in vitro, with oligoclonal to monoclonal integrations detected after extended growth. B) MA9-transduced CB cells were injected immediately after transduction and leukemic cells from sick mice were analyzed for integration site by Southern blotting. *background band. C–F) Cells from MA9.16 myeloid and lymphoid cultures were injected into NS-B2M mice. Upon illness, leukemic cells were recovered and analyzed by Southern blotting for clonal relatedness. Organs from the clonally related leukemias shown in panel D were analyzed for myeloid and lymphoid markers by flow cytometry.
Figure 5
Figure 5. CD19+ cells generate myeloid and lymphoid progeny
A) A mixed culture was separated by cell sorting into CD19+33− and CD19−33+ populations. Cells were grown for one month in the indicated cytokines, and stained for the indicated surface molecules. Only the 19+33− population of cells was able to regenerate the lineage potential of the parent population. B) Southern blot analysis was performed on the indicated populations of cells. The original CD33+ population is clonally unique and represents an AML LSC present in the parent population. The CD33+ population generated from the CD19+ sorted cells [(CD19+)→CD33+] shows clonal identity to the B-ALL LSC present in the parent culture. C) Cells from each population were analyzed by Wright-Giemsa staining one month after sorting. Scale bars represent 10 µm. D) Some CD33+ clones were able to produce B-ALL while others gave rise to pure AML in NOD/SCID mice.
Figure 6
Figure 6. Gene expression profile of MLL-AF9 expressing cells resembles human AML
A) The plot depicts the principal component analysis of data for the 100 most differentially expressed genes in the CBF versus MLL leukemia samples from two published studies. Cell culture samples group closely with the respective patient samples from the 2 independent studies. Additionally, the plot suggests a closer relationship of cell culture samples to the pediatric AML data set (Ross). B) Hierarchical clustering of differentially expressed genes. The graph shows the heatmap of CBF and MLL leukemia patient samples as well as their respective cell culture samples (rows) based on the 100 genes (columns) most differentially expressed in CBF versus MLL leukemia samples.
Figure 7
Figure 7. Suppression of MA9 cell growth by a Rac-specific inhibitor, NSC23766 and by Rac1 knockdown
The transduced, long-term cultured MA9 and AE cord blood cells and two-week cultured cord blood cells were plated in the presence of various concentrations of NSC23766 as indicated. A) 48hr cell growth was measured by a MTT assay using absorbance at 570nm. B) 48hr cell cycle arrest was analyzed by propidium iodine staining and flow cytometry. C) 48hr apoptosis response was analyzed by Annexin V staining and flow cytometry. In A–C, data represent the average ±SD. At least three experiments were performed using three different MA9 cell cultures. *, P < 0.001, or **, P < 0.05, NSC23766-treated vs. non-treated cells. D) Bcl-2 and Bcl-xL protein levels after 24 hours of drug treatment. Asterisks indicate potentially ubiquitinated protein, and arrowheads designate possible degradation products. E) Lentivrial knockdown of Rac1 in MA9 and AE cells results in specific induction of apoptosis in the MA9 cells as shown by Annexin V/7-AAD staining. Two independent Rac-targeting shRNA were used. F) The mean ± SD of 3–5 experiments is shown. *p<.05, **p<.001 G) Western blot for Rac1 protein expression demonstrates the loss of expression in the Venus-sorted cells that received the shRac constructs.

Comment in

References

    1. Armstrong SA, Kung AL, Mabon ME, Silverman LB, Stam RW, Den Boer ML, Pieters R, Kersey JH, Sallan SE, Fletcher JA, et al. Inhibition of FLT3 in MLL. Validation of a therapeutic target identified by gene expression based classification. Cancer Cell. 2003;3:173–183. - PubMed
    1. Armstrong SA, Mabon ME, Silverman LB, Li A, Gribben JG, Fox EA, Sallan SE, Korsmeyer SJ. FLT3 mutations in childhood acute lymphoblastic leukemia. Blood. 2004;103:3544–3546. - PubMed
    1. Armstrong SA, Staunton JE, Silverman LB, Pieters R, den Boer ML, Minden MD, Sallan SE, Lander ES, Golub TR, Korsmeyer SJ. MLL translocations specify a distinct gene expression profile that distinguishes a unique leukemia. Nat Genet. 2002;30:41–47. - PubMed
    1. Baer MR, Stewart CC, Lawrence D, Arthur DC, Mrozek K, Strout MP, Davey FR, Schiffer CA, Bloomfield CD. Acute myeloid leukemia with 11q23 translocations: myelomonocytic immunophenotype by multiparameter flow cytometry. Leukemia. 1998;12:317–325. - PubMed
    1. Barabe F, Kennedy JA, Hope KJ, Dick JE. Modeling the initiation and progression of human acute leukemia in mice. Science. 2007;316:600–604. - PubMed

Publication types

MeSH terms

Substances

Associated data